
Fig. 4.
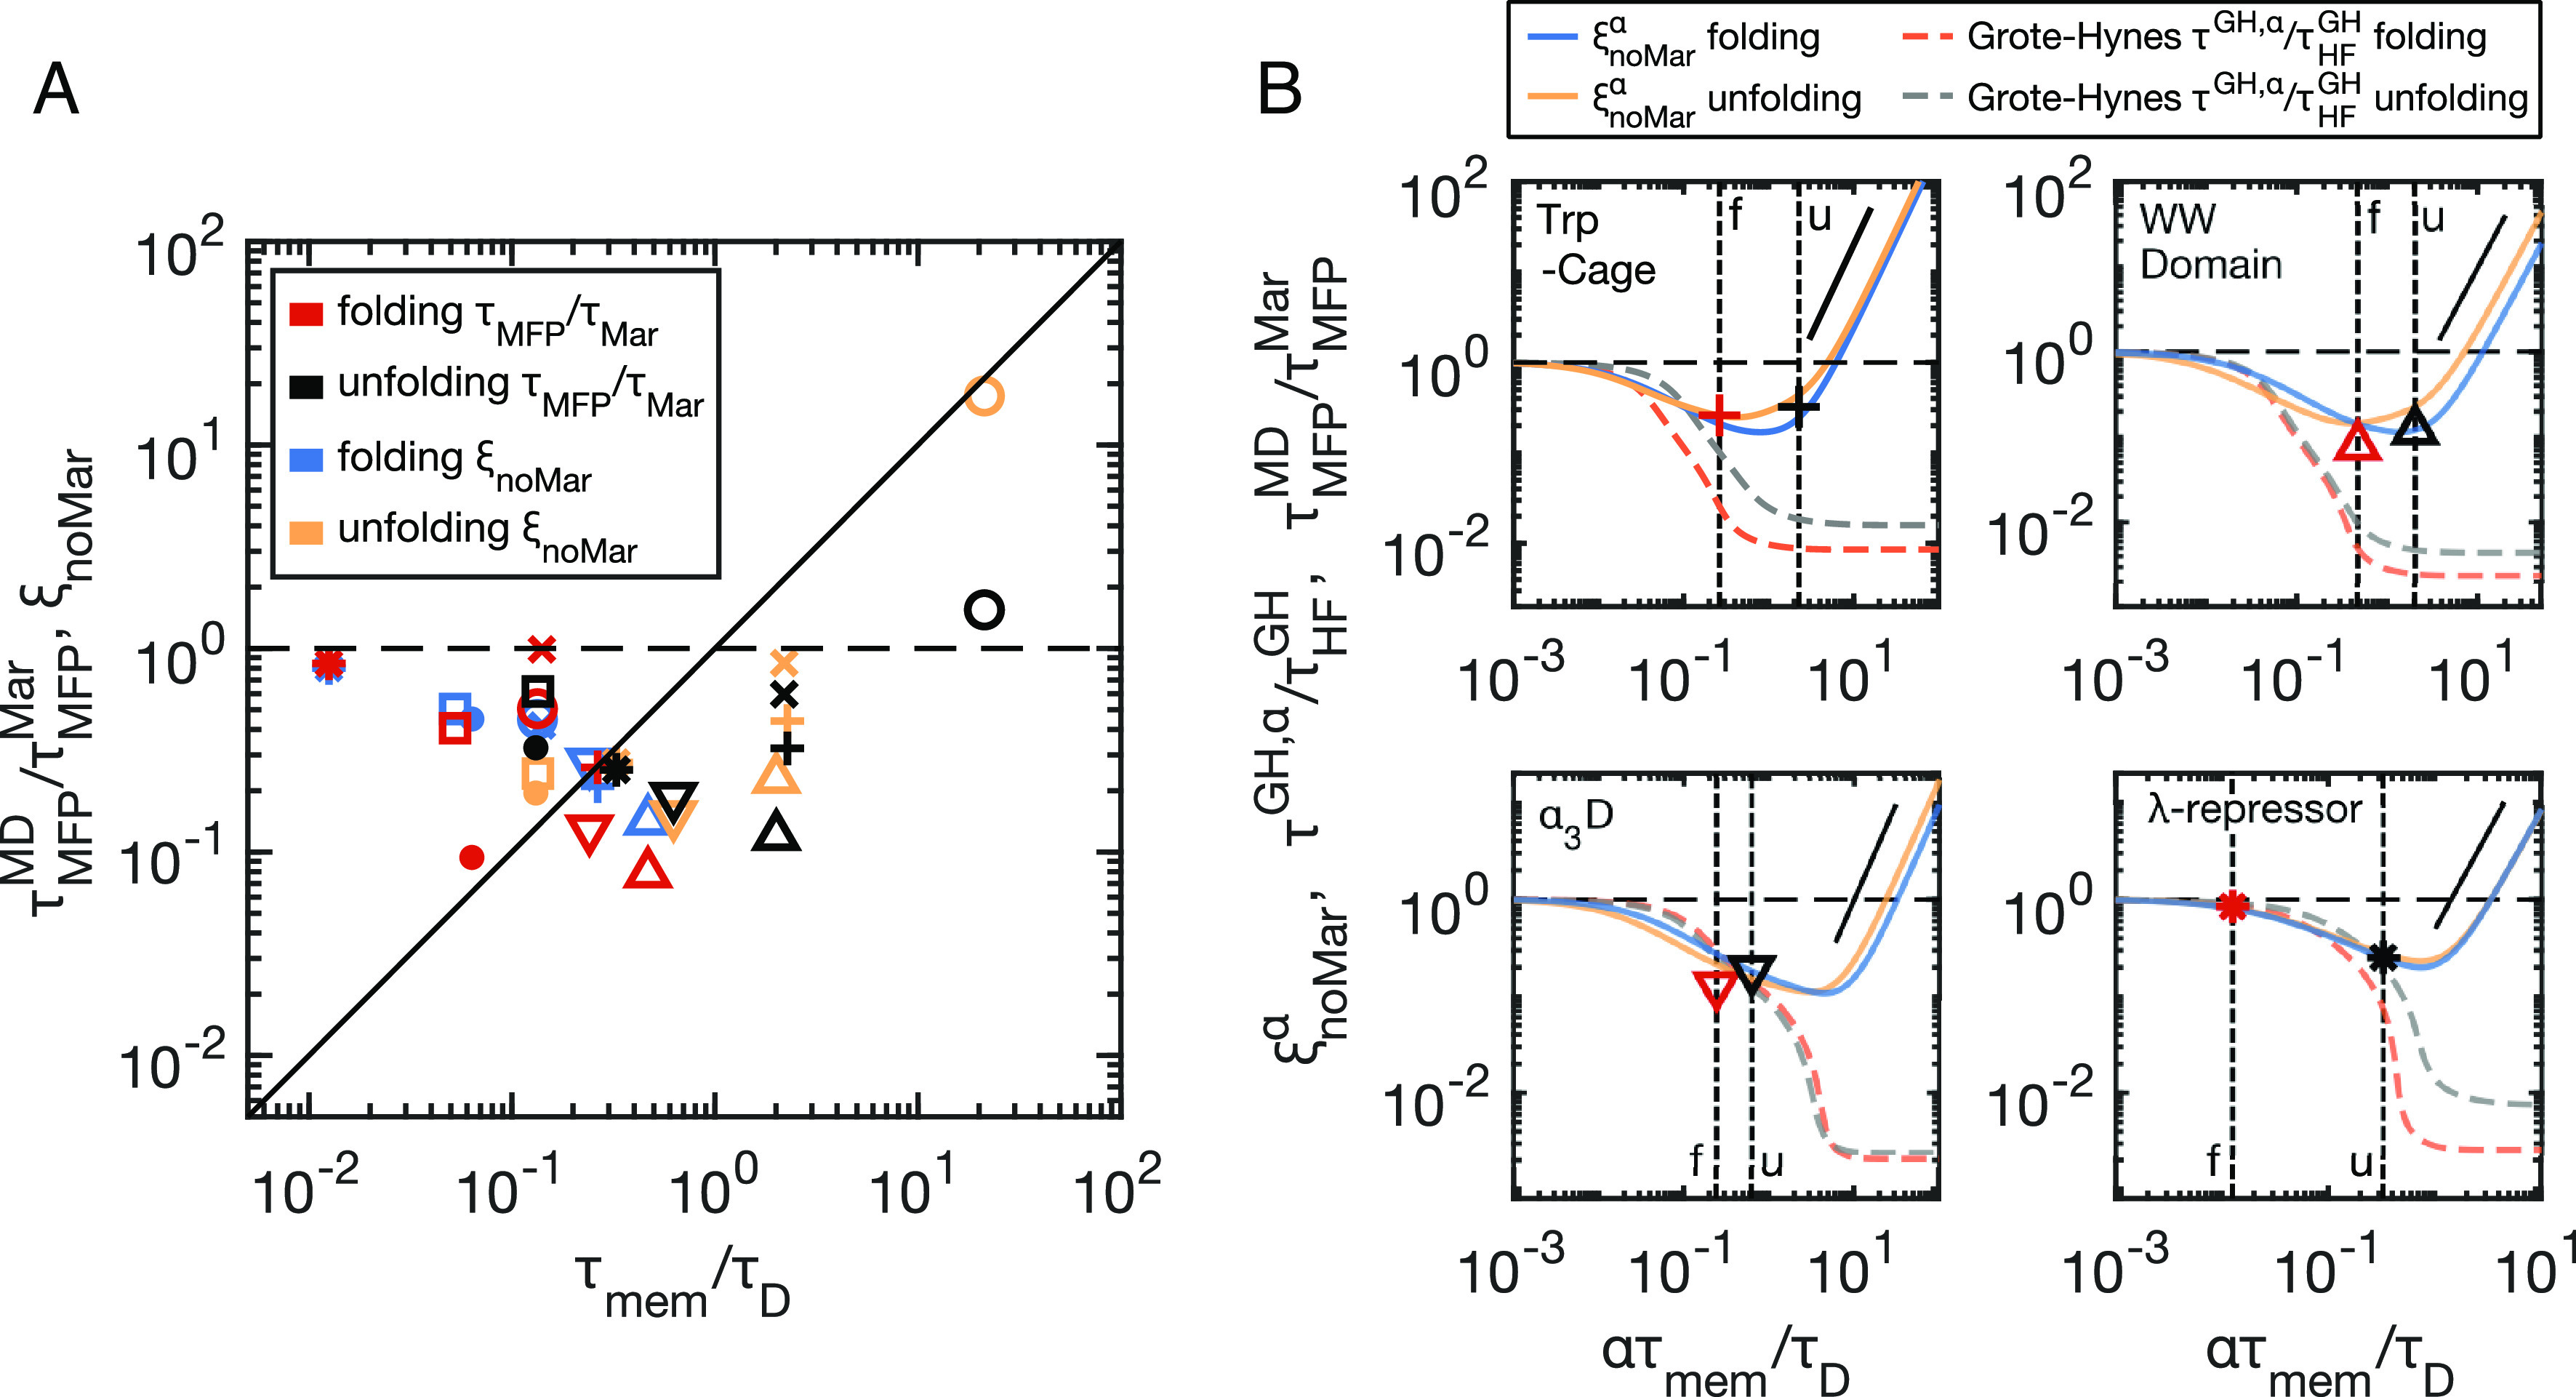
Barrier crossing times indicate memory-induced speed up. (A) Deviations from Markovian barrier crossing kinetics, plotted as a function of rescaled memory times τmem/τD, for the folding and unfolding of all eight proteins. Rescaled MD simulation values for each protein (, red and black symbols) are compared to multimodal, non-Markovian prediction (ξnoMar, Eq. 4, blue and yellow symbols). See Fig. 2 for symbol legend. (B) Reaction-time curves generated by scaling all memory times by a common factor α. Vertical dashed lines indicate α = 1, which are different for folding (f) and unfolding (u) due to unique τD values. The multimodal non-Markovian prediction ( from Eq. 4—folding (blue) and unfolding (yellow)) is compared to the Grote–Hynes prediction (τGH, α from Eq. M6), rescaled by the memoryless, high-friction limit ( - Eq. M10) for folding (orange) and unfolding (grey). The blue and yellow symbols shown in (A) for the four example proteins coincide with the curve intercepts of the α = 1 lines in (B) for . The red and black symbols are the same as those shown in (A), corresponding to the MD results for each protein, located at α = 1. The solid black lines show quadratic scaling, predicted for ξnoMar in the long memory-time limit. Dashed horizontal black lines show unity for all plots.