Figure 5.
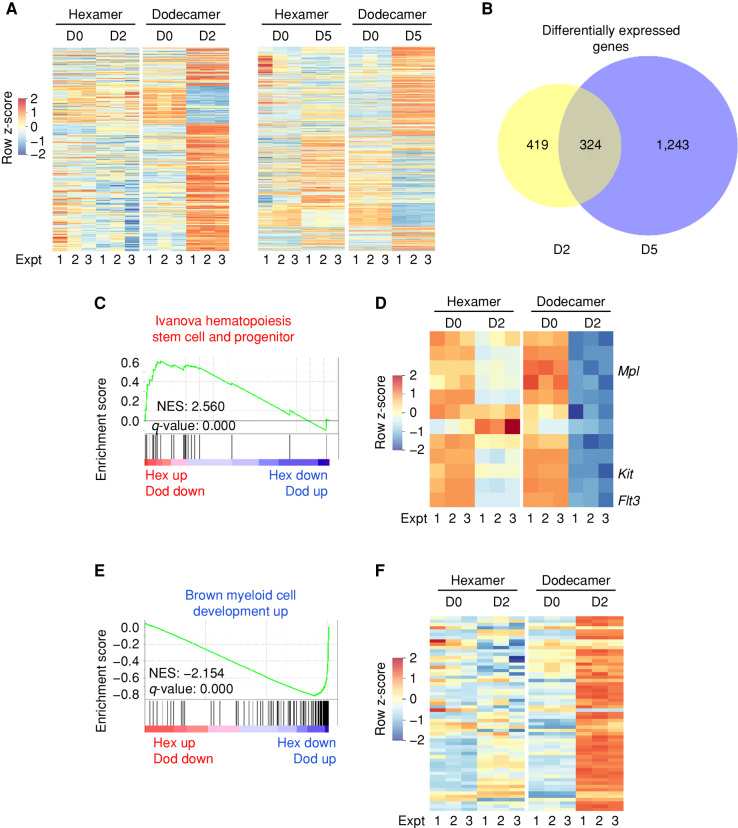
The hexameric IL3R induces an HSPC-like transcriptional state. A, Heat map showing differential gene expression data in FDH cells expressing bc and IL3Rα P248L (hexamer) or WT (dodecamer) after 2 and 5 days of IL3 treatment for 3 independent experiments (Expt). B, Number of differentially expressed genes between cells expressing hexameric versus dodecameric IL3R after 2 and 5 days of IL3 treatment. q < 0.05, fold change >2. C, GSEA plot showing enrichment of the stem/progenitor cell signature in FDH cells expressing bc and IL3Rα P248L. Dod, dodecameric; Hex, hexameric; NES, normalized enrichment score. D, Heat map showing enrichment of the stem/progenitor cell signature in FDH cells expressing bc and IL3Rα P248L with specific genes. E, GSEA plot showing loss of the myeloid cell differentiation signature in cells expressing the IL3R hexamer. F, Heat map showing negative enrichment of the myeloid cell differentiation signature in cells expressing bc and IL3Rα P248L.

