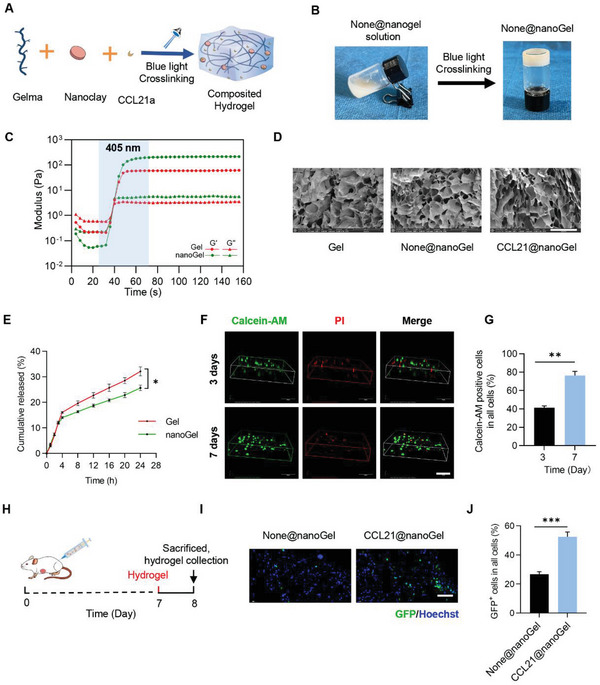
Figure 1.

Preparation and characterization of CCL21a@nanoGel. A) Schematic showing the formulation of CCL21a@nanoGel. B) Representative image showing the sol–gel transition of None@nanogel. C) Rheological analysis of the Gel and None@nanoGel. The curves of the energy storage modulus (G′) and loss modulus (G″) during the crosslinking of Gel (10 wt%) or None@nanoGel (10 wt%). D) Scanning electron microscope images of Gel (GelMA), None@nanoGel (Nanoclay+GelMA), and CCL21a@nanoGel (CCL21a+Nanoclay+GelMA). Scale bars, 300 µm. E) Profile of CCL21a released from the indicated hydrogels. Data are expressed as mean ± S.E.M (Standard Error of Mean) of three independent experiments. *, p < 0.05 by two‐way ANOVA. F) Cell viability of CT26.WT in the hydrogels was measured by Calcein‐AM/PI staining at the indicated time. Calcein‐AM, green; PI, red. Scale bar, 100 µm. G) The hydrogels were treated with gel lysis solution at 37 °C and isolated Calcein‐AM positive cells were counted. Data are expressed as mean ± S.E.M of three independent experiments. **p < 0.01 by the unpaired Student's t‐test. H) Schematic illustration of the experimental procedure. CT26.WT‐GFP colon tumor‐bearing mice were injected with None@nanoGel or CCL21a@nanoGel beside the tumor on day 7, followed by the analysis of the gel on day 8. I) Representative fluorescence microscopic images showing the chemotaxis of CT26.WT‐GFP. Scale bar, 100 µm. J) The hydrogels were treated with gel lysis solution at 37 °C and the isolated GFP+ cancer cells were then counted. Data are expressed as mean ± S.E.M of three independent experiments. ***p < 0.001 by the unpaired Student's t‐test.
