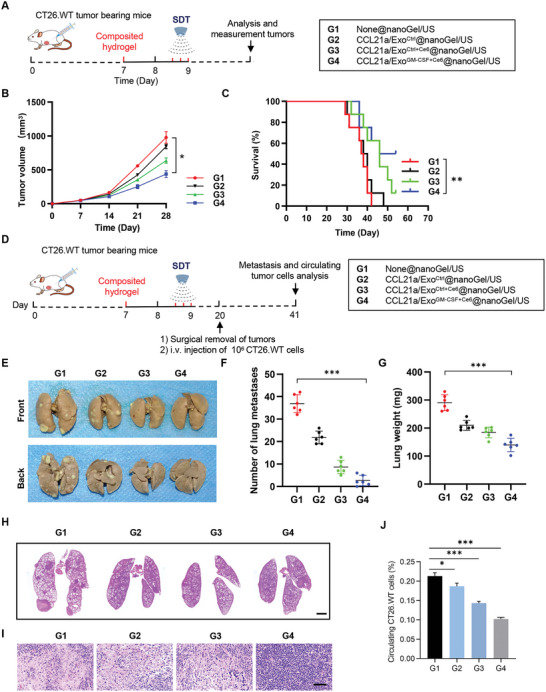
Figure 4.

CCL21a/ExoGM‐CSF+Ce6@nanoGel/US prevents tumor progression in CT26.WT mouse model. A) Schematic illustration of the experimental procedure analyzing the tumor inhibition effects of the hydrogels. B) Tumor growth in mice treated with indicated hydrogels. Tumor size was monitored every 7 days. Data are expressed as mean ± S.E.M; n = 7–8 mice per group. *, p < 0.05 by two‐way ANOVA. C) Survival curves of CT26.WT tumor‐bearing mice treated with indicated hydrogels. n = 8 mice per group. **, p < 0.01 by log‐rank test. D) Schematic illustration of the experimental procedure analyzing metastasis prevention effects of the hydrogels. CT26.WT tumor‐bearing mice were randomly divided into four groups. On the 7th day of subcutaneous tumor inoculation in mice, hydrogels with different components were injected beside the tumor. Ultrasound irradiation was performed every 4 h for three times on day 8 after hydrogel injection. Tumors were surgically removed on the 20th day and the mice were challenged by i.v. injection of CT26.WT cells.The mice were sacrificed and lungs and tumor‐draining lymph nodes were harvested for further analysis on day 41. E) Representative images of lungs excised on day 41 in indicated groups. F) The number of lung metastatic nodules. Data are expressed as mean ± SD; n = 6. ***, p < 0.001 by one‐way ANOVA. G) Lung weights. Data are expressed as mean ± SD; n = 6. ***, p < 0.001 by one‐way ANOVA. H) Representative H&E staining of the lung sections from mice with indicated treatments. n = 6. Scale bar, 2000 µm. I) Representative H&E staining of the tumor‐draining lymph node sections from mice with indicated treatments. n = 6. Scale bar, 50 µm. J) Percentages of circulating CT26.WT‐GFP cells in peripheral blood from mice with indicated treatments. Data are expressed as mean ± S.E.M; n = 6. *, p < 0.05, ***, p < 0.001 by one‐way ANOVA.
