Figure 3.

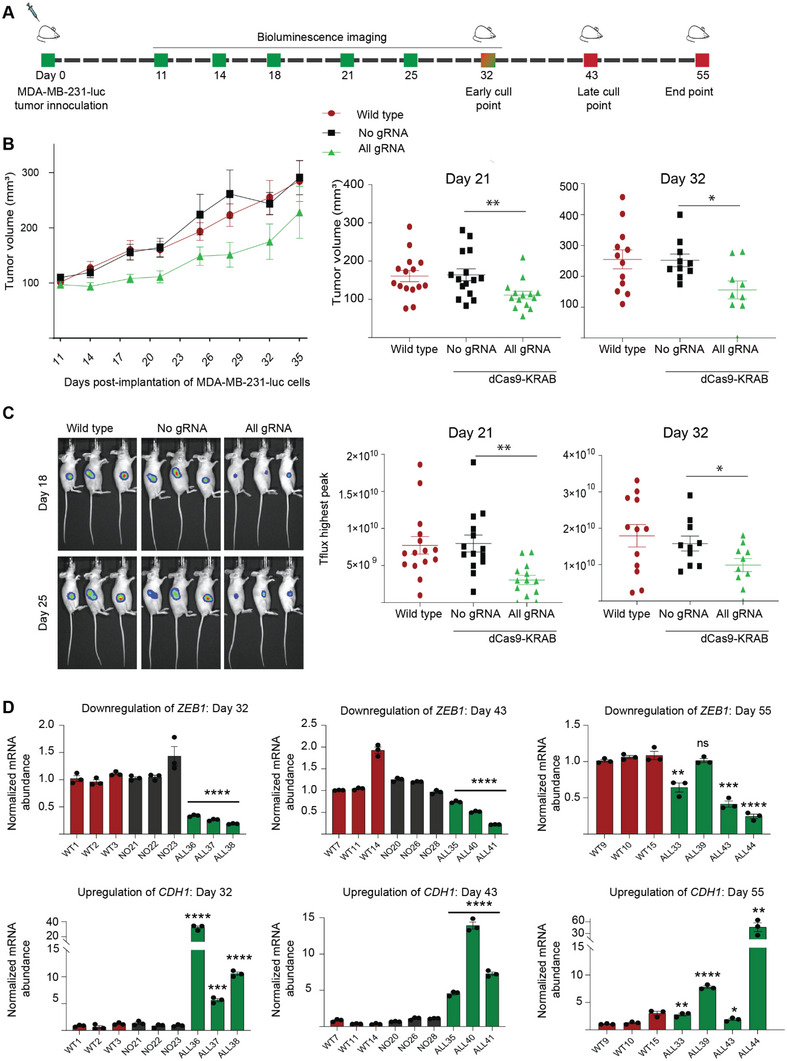
Tumor‐intrinsic repression of ZEB1 in vivo suppresses the growth of breast cancer xenograft tumor models. (A) Schematic representation of the experimental time‐line. MDA‐MB‐231 cells labeled with a luciferase gene (MDA‐MB‐231‐luc) were transduced with either dCas9‐KRAB in absence of gRNA (No gRNA) or with dCas9‐KRAB with all designed gRNAs (All gRNA). Wild type refers to untranduced cells (MDA‐MB‐231‐luc with no dCas9‐KRAB transduction). 2 × 10⁶ cells were implanted into the flank of BALB/c nude mice (n = 15 mice per group) and tumor growth monitored by caliper measurement and bioluminescence imaging (BLI). Mice (n = 3) were euthanized at day 32 for an “early” and at day 43 for a “late” time‐point for histological assessment; day 55 refers to experimental end‐point (volume of the tumors >1000 mm3). Bioluminescence was quantified at days 11, 14, 18, 21, 25, and 32 post‐implantation of the cells. (B) Tumor growth inhibition in vivo for the MDA‐MB‐231‐luc xenograft model assessed by caliper measurements, starting at day 11 post‐implantation when the tumor growth is ≈100 mm3 (at left). Scatter dot plots outlining the decrease in tumor volume at day 21 and day 32 post‐implantation of cells are indicated (at right) *p ≤ 0.05, ** p ≤ 0.01. Error bars represent S.E.M. (C) Representative bioluminescence images of mice in un‐transduced wild type and No gRNA versus All gRNA group captured at days 18 and 25. Tflux peaks are plotted at day 21 and day 32 post inoculation, * p ≤ 0.05, *** p ≤ 0.001. Error bars represent S.E.M. (D) Expression of ZEB1 and CDH1 assessed by qRT‐PCR from RNA extracted from tumors, each individual tumor is indicated separately, *p ≤ 0.05, **p ≤ 0.01, ***p ≤ 0.001, ***p ≤ 0.0001, ns = non‐significant. Error bars represent S.E.M. WT: untransduced wild type group; NO: No gRNA; ALL: All gRNA; KRAB: Krüppel associated box.
