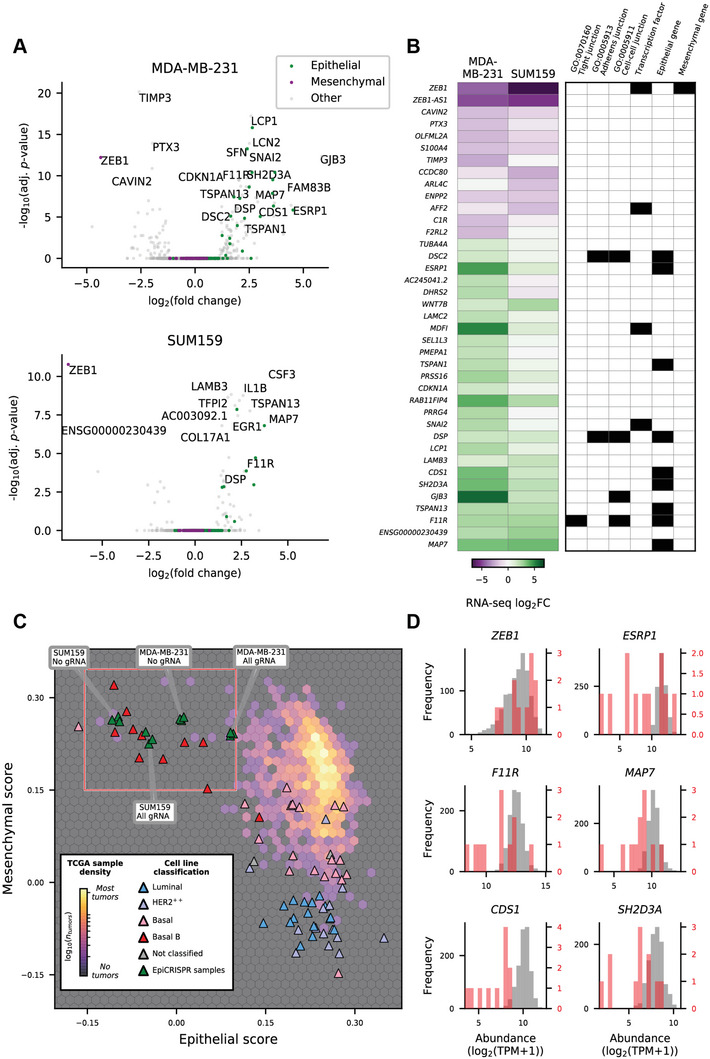
Figure 5.

ZEB1 silencing by dCas9‐KRAB induces partial mesenchymal‐to‐epithelial transition. (A) Volcano plots showing changes in transcript abundance assessed by bulk RNA‐sequencing; statistical significance for differential expression of genes between the All gRNA treatment and No gRNA for MDA‐MB‐231 cells (at top) and SUM159 cells (at bottom). Genes annotated as epithelial or mesenchymal by Tan et al. (2014) are shown. (B) A heatmap showing changes in transcript abundance for genes with significant differential expression (adj. p‐value < n) between the All gRNA treatment and No gRNA for MDA‐MB‐231 cells or SUM159 cells (at left), together with associated Gene Ontology annotations, or Tan et al. (2014) classification as an epithelial or mesenchymal gene (at right). (C) A hexbin density plot showing the distribution of TCGA tumor samples when scored with epithelial or mesenchymal gene sets, overlaid with SUM159 and MDA‐MB‐231 RNA‐seq data from this study and CCLE breast cancer cell lines that have been annotated by their subtype classification. (D) Histograms showing the transcript abundance (logTPM) of selected genes (plot titles) within TCGA tumor samples with a relatively high mesenchymal score (<0.15) and low epithelial score (<0.1); corresponding to rare claudin‐low/metaplastic tumors (in red) and all other TCGA tumor samples (in gray). adj. p‐value: adjusted p‐value, log2FC: log 2 fold‐change, Log2(TPM): log2 of the transcript count per million. Her2+: human epidermal growth factor receptor 2 positive breast cancer, Basal: Basal‐like breast cancer, Luminal: Luminal breast cancers, TCGA: The Cancer Genome Atlas.
