
Figure 3.
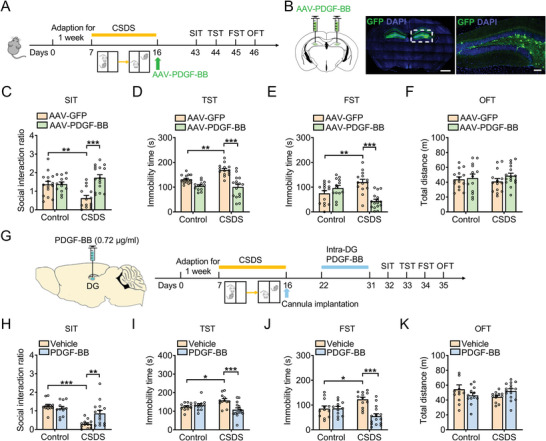
Overexpression of PDGF‐BB reverses CSDS‐induced depressive‐like behaviors of mice. A) Experimental timeline of viral infusion, CSDS protocol, and behavioral tests. B) Representative photomicrographs of injection sites in the hippocampal DG and panels on the right are infected neurons. Scale bars: 1000 µm (left), 100 µm (right). C) Effects of PDGF‐BB overexpression on the social interaction ratio in SIT. n = 13–16 per group. D) Effects of PDGF‐BB overexpression on immobility time in TST. n = 13–16 per group. E) Effects of PDGF‐BB overexpression on the immobility time in FST. n = 13–16 per group. F) Effects of PDGF‐BB overexpression on the locomotor activity in OFT. n = 13–16 per group. G) Schematic timeline of CSDS protocol, PDGF‐BB treatment, and behavioral tests. H) Effects of PDGF‐BB treatment on the social interaction ratio in SIT. n = 12–15 per group. I) Effects of PDGF‐BB treatment on the immobility time in TST. n = 12–15 per group. J) Effects of PDGF‐BB treatment on the immobility time in FST. n = 12–15 per group. K) Effects of PDGF‐BB treatment on the locomotor activity in OFT. n = 12–15 per group. Data are expressed as mean ± SEM. Two‐way ANOVA followed by the Bonferroni's post hoc test (C–F, H–K). *p < 0.05, **p < 0.01, ***p < 0.001. The statistical details can be found in Table S4, Supporting Information.