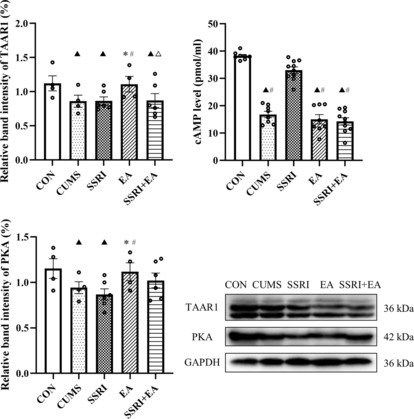
FIGURE 6.

Changes in TARR1, cAMP, and PKA among groups. Data were presented as mean ± standard error of the mean (vmPFC for enzyme‐linked immunosorbent assay: n = 8 in CON, CUMS, and EA groups; n = 10 in SSRI and SSRI + EA groups. vmPFC for western blot: n = 4 in CON, CUMS, and EA groups; n = 6 in SSRI and SSRI + EA groups). ▲ p < 0.05 compared with CON, *p < 0.05 compared with CUMS, # p < 0.05 compared with SSRI, and △ p < 0.05 compared with EA by one‐way analysis of variance with least significance difference post hoc comparison (Relative band intensity of TAAR1: F = 3.310, p = 0.023. CAMP level: F = 82.490, p < 0.05. Relative band intensity of PKA: F = 3.955, p = 0.009. All df = 4). CUMS, chronic unpredictable mild stress; cAMP, cyclic adenosine monophosphate; EA, electroacupuncture; PKA, protein kinase A; SSRI, selective serotonin reuptake inhibitor; TAAR1, trace amine‐associated receptor 1; vmPFC, ventromedial prefrontal cortex.
