
Figure 3.
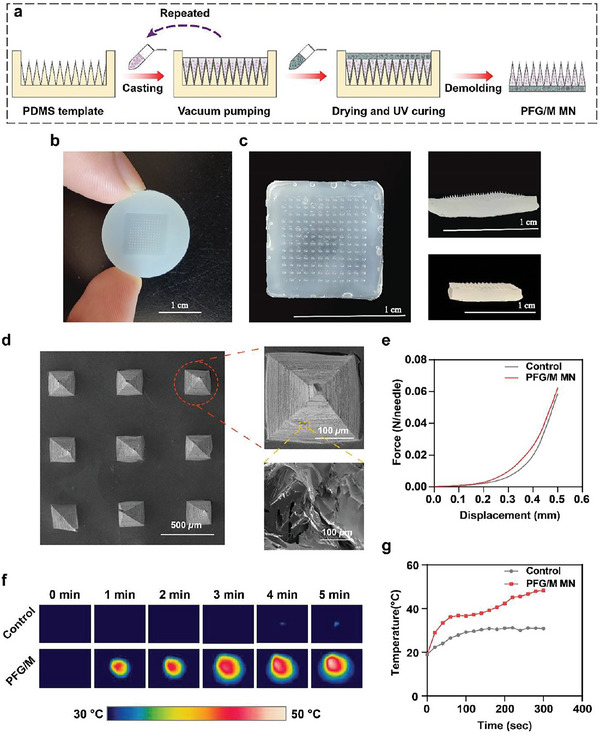
a) Schematic illustration of the preparation of the PFG/M MN patch. b) Optical image of the PDMS mold. c) Optical image of the PFG/M MN patch. d) SEM image of the PFG/M MN patch. e) Force‐displacement curves of the MNs. f) Infrared thermal images and g) photothermal curves of the MNs irradiated with a 660 nm laser at 1 W cm−2 for 5 min.