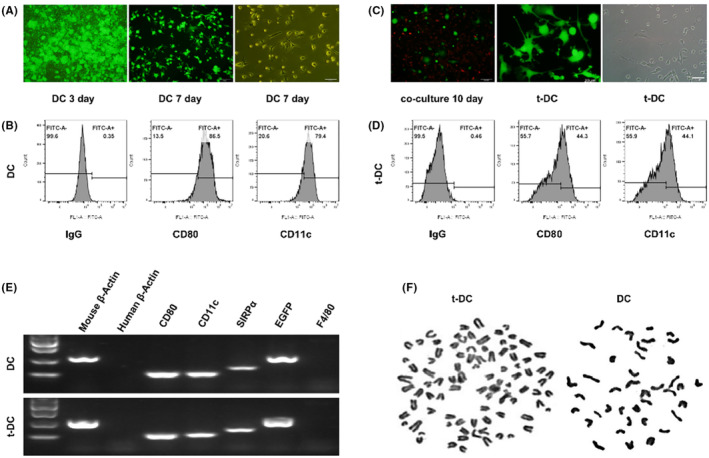
FIGURE 2.

Comparison of phenotypes of t‐DCs and normal DCs. (A) Primary culture of DCs from GFP BALB/c nude mice. (B) Flow cytometry for CD80 and CD11c expression of DCs. (C) Cloning of highly proliferative EGFP+ DCs. (D) Flow cytometry for CD80 and CD11c expression of t‐DCs. (E) RT‐PCR analysis for cell surface markers of both normal DCs and t‐DCs. (F) The chromosome karyotype of DCs and t‐DCs.
