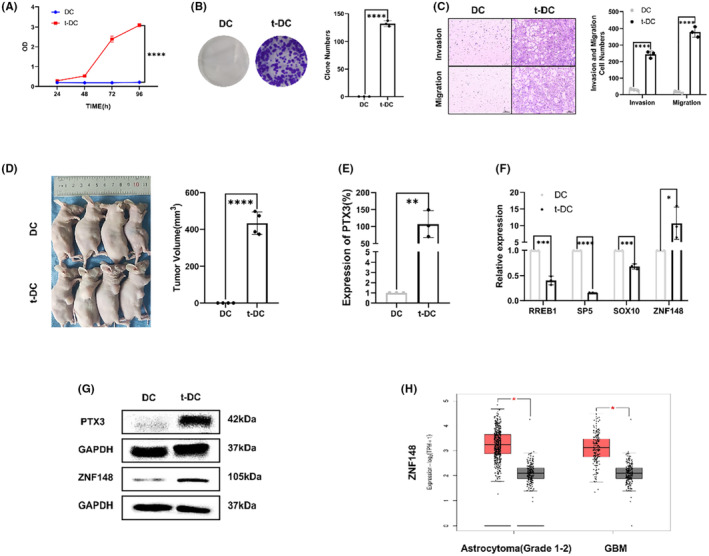
FIGURE 3.

Analysis of the proliferation and invasion of t‐DCs. (A, B) Analysis of cell proliferation of DCs and t‐DCs by CC8 and clone formation assay. (C) Cell invasion and migration assay of t‐DCs. (D) Tumorigenicity assay of t‐DCs. (E) Quantitative RT‐PCR on PTX3 expression in t‐DCs. (F) Quantitative RT‐PCR on 4 candidate TFs, including RREB1, SP5, SOX10, and ZNF148 expression in t‐DCs. (G) Western blot on PTX3 and ZNF148 expression in t‐DCs. (H) ZNF148 expression of gliomas in TCGA database. Data are expressed as mean ± SD, *p < 0.05, **p < 0.01, ***p < 0.001.
