Figure 3.

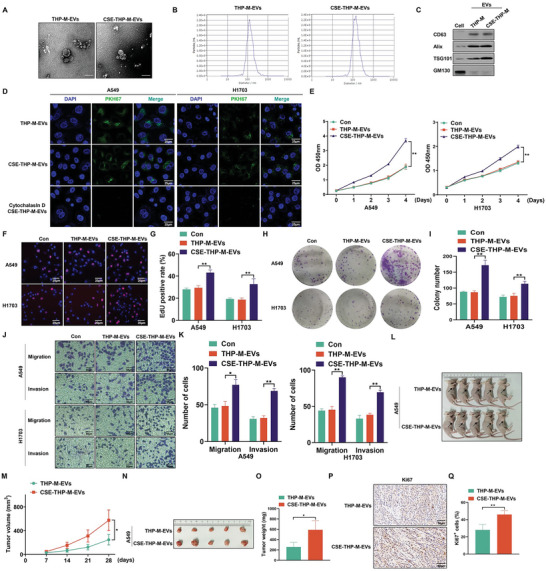
CSE promotes the progression of NSCLC cells through secreting EVs from M2 macrophages in vitro and in vivo. THP‐M were exposed to 4% CSE for 48 h. A) The shape of EVs was characterized by TEM of purified THP‐M‐EVs and CSE‐THP‐M‐EVs. Scale bar, 200 nm. B) The particle number and size analysis of EVs were assessed for THP‐M and CSE‐THP‐M. C) Western blots were performed for cells and EVs. D) Representative images of incubation with THP‐M‐EVs and CSE‐THP‐M‐EVs labeled with PKH67 (green) with A549 and H1703 cells. The proliferation of A549 and H1703 cells was determined by E) CCK‐8 assays. F) EdU assays and G) EdU‐positive rates were determined. H) Colony formation assays were performed, and I) the numbers of colonies were determined for A549 and H1703 cells. J) Representative images of Transwell assays, and K) migration and invasion were determined for A549 and H1703 cells. L) Tumors in the subcutaneous layer were observed in both groups. (The arrows point to tumor xenografts.) M) Tumor volume summary for mice, measured every seven days. N) Images of xenograft tumors harvested from nude mice. O) Nude mice were examined for tumor weights (n = 5). P) IHC staining for Ki67 was measured (n = 5), and Q) measurement of Ki67‐positive signals in tumor tissues harvested from nude mice (n = 5, randomly selected fields per group). Scale bar, 50 µm. Three independent experiments were conducted. All data represent means ± SD. *p < 0.05; ** p < 0.01.
