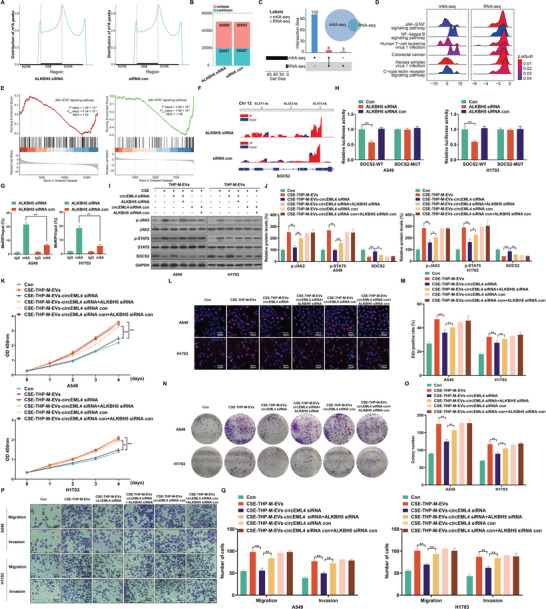
Figure 6.

circEML4 in EVs from CSE‐induced M2 macrophages regulates m6A modification of SOCS2 via ALKBH5 in promoting the progression of NSCLC cells. A) The distribution of m6A peaks over the length of mRNA transcripts was analyzed for A549 cells transfected with ALKBH5 siRNA or siRNA con. B) Numbers of m6A peaks revealed by m6A‐seq from A549 cells transfection with ALKBH5 siRNA or siRNA con. C) The number of pathways by GSEA enrichment analysis at m6A and mRNA levels. D) The distribution of the core genes of the enrichment pathway was displayed, and each gene's log2 fold change was represented on the x‐axis. > 0 represented up‐regulated expression; < 0 represented down‐regulated expression. E) GSEA enrichment plot of the JAK‐STAT signaling pathway recognized by m6A‐seq and RNA‐Seq. F) Peaks demonstrating the abundance of m6A sites in SOCS2 mRNA. G) MeRIP‐qPCR determinations for m6A enrichment on SOCS2 mRNA in A549 and H1703 cells. H) Relative activities of the WT and Mut luciferase reporters. THP‐M were exposed to 4% CSE for 48 h. I) Western blots were performed, and J) relative protein levels of p‐JAK2, p‐STAT5, and SOCS2 were measured for A549 and H1703 cells. The proliferation of A549 and H1703 cells was assessed by K) CCK‐8 assays. L) EdU assays and M) EdU‐positive rates were determined. N) Colony formation assays were performed, and O) colony formation was determined for A549 and H1703 cells. P) Representative images of Transwell assays, and Q) migration and invasion were determined for A549 and H1703 cells. Three independent experiments were conducted. All data represent means ± SD. *p < 0.05; ** p < 0.01.
