
Figure 10.
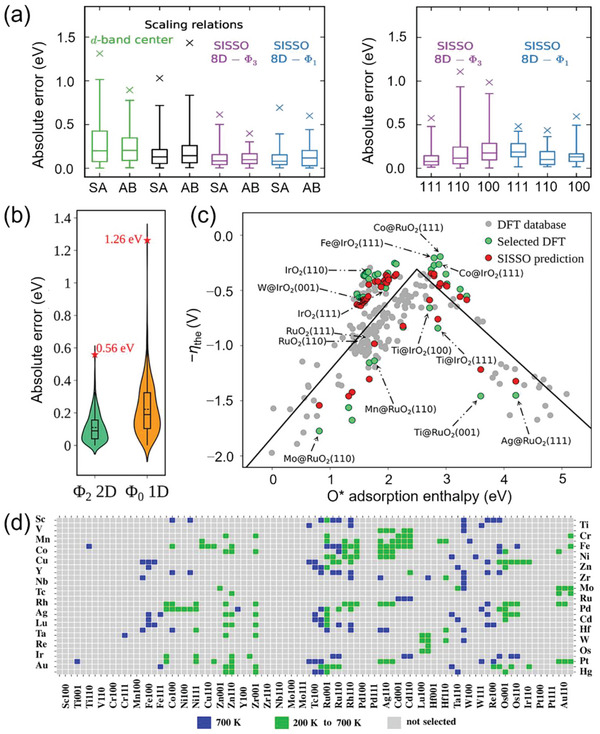
a) Box plots of the absolute errors for the d‐band center, scaling relations, and best SISSO descriptors. The upper and lower limits of the rectangles mark the 75th and 25th percentiles; the internal horizontal line marks the median, and the error bars mark the 99th and 1st percentiles. The crosses mark the maximum absolute errors. SA = single atom alloy; AB = bimetallic alloy. Reproduced with permission.[ 45a ] Copyright 2019, American Chemical Society. b) Violin plot of the distribution of absolute validation errors for the Φ2‐2D and Φ0‐1D descriptors. c) Negative theoretical overpotential η the as a function of O* adsorption enthalpy. The black curve is the volcano predicted from the standard scaling relations. Selected DFT‐computed (green) and corresponding SISSO‐predicted (red) theoretical overpotentials are shown. Reproduced with permission.[ 45b ] Copyright 2021, American Chemical Society. d) High‐throughput screening of single‐atom‐alloy catalysts by SISSO. Promising candidates at different temperatures are highlighted. Vertical and horizontal axes display the guest atom type and the host metal surfaces, respectively. Reproduced with permission.[ 47 ] Copyright 2021, Springer Nature.