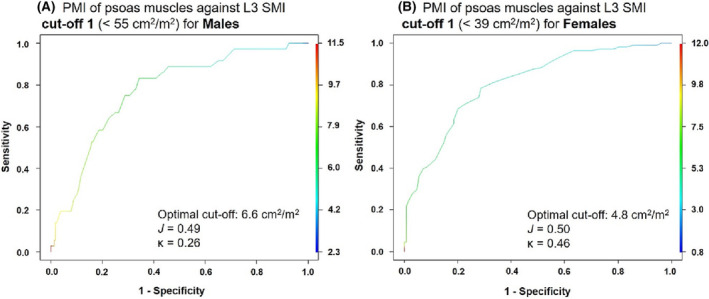
Figure 2.

ROC curves based on SMI values of both psoas muscles together, for (A) males and (B) females with and without sarcopenia as per cut‐off 1. 12

ROC curves based on SMI values of both psoas muscles together, for (A) males and (B) females with and without sarcopenia as per cut‐off 1. 12