Figure 6.

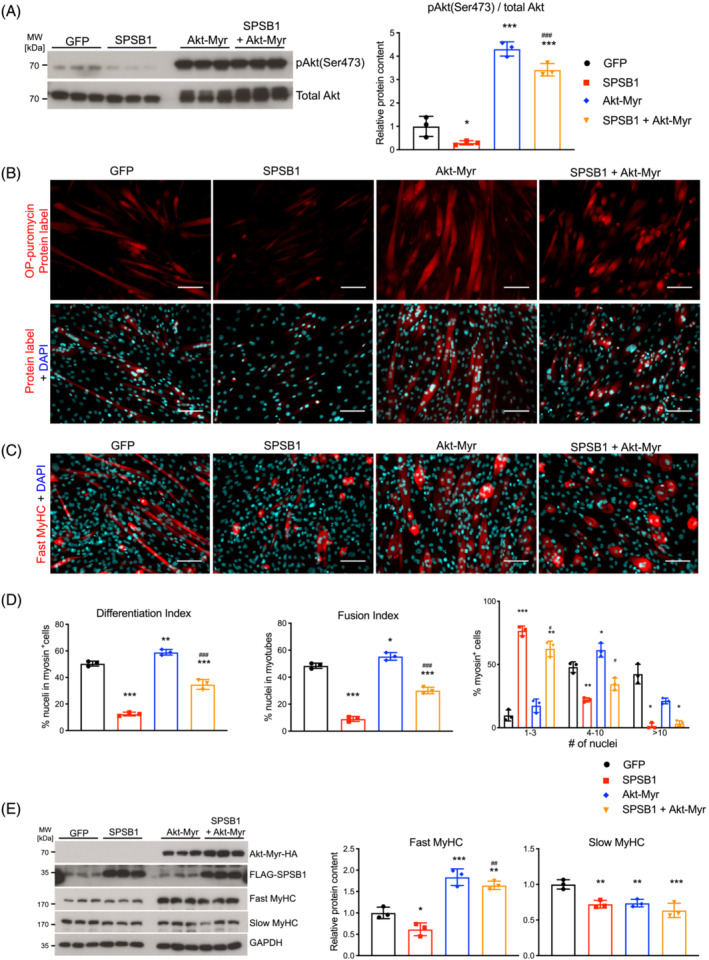
Expression of Akt restores myogenesis in SPSB1 overexpressing cells. Cells were transduced by control GFP, SPSB1, Akt‐Myr, respectively, or co‐transduced by Akt‐Myr and SPSB1 retrovirus and differentiated for 5 days. (A) Western blot analysis of anti‐phospho Akt antibody (Ser473). Total Akt was used as control. Densitometric analysis is displayed in the right panel. (B) Cells described above were incubated with OP‐puro labelling for 1 h. Red fluorescence (upper panel) corresponds to de novo synthesized polypeptides. (C) Immunofluorescent staining of above cells with anti‐Fast MyHC as primary antibody and Alexa Fluor 555 conjugated secondary antibody (red). Scale bar, 100 μm. (D) Differentiation index, Fusion index, and Distribution of nuclei in myosin positive (myosin+) cells were quantified from images in panel (C). (E) Western blot was performed using lysates from above cells with anti‐Fast MyHC and anti‐Slow MyHC antibody. Overexpressed Akt‐Myr and SPSB1 were detected by anti‐HA and anti‐FLAG antibody, respectively. GAPDH was used as loading control. Densitometric analysis of Western blot signals are displayed (right panel). Data in panels (A), (D; differentiation and fusion index) and (E) were analysed with one‐way ANOVA followed by Tukey's post‐hoc test; data in panel (D; myosin+ cells) were analysed with two‐way ANOVA followed by Tukey's post‐hoc test. Asterisk (*) indicates a significant difference between SPSB1‐, Akt‐Myr‐ or SPSB1 and Akt‐Myr‐treated groups compared with GFP control treated cells, *P < 0.05, **P < 0.01, ***P < 0.001; # indicates a significant difference between SPSB1‐ and SPSB1 + Akt‐Myr‐treated cells, # P < 0.05, ## P < 0.01, ### P < 0.001. N = 3 biologically independent experiments; data are presented as mean ± standard deviation.
