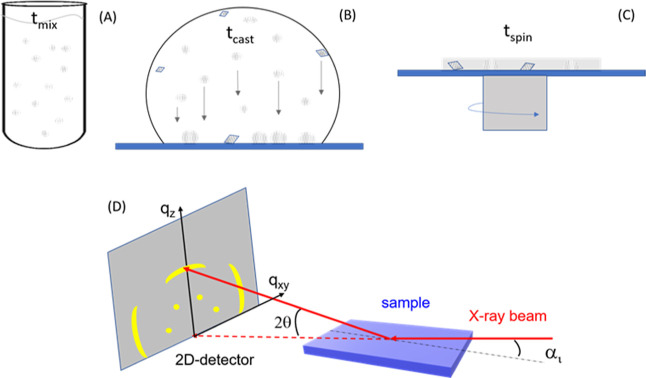
Figure 1.
Sequential different stages of sample preparation. (A) Mixing of the reactants, calcium hydroxide, and carbonic acid; tmix indicates the time of mixing. (B) Deposition of the CaCO3 particles on the substrate for a time tcast. (C) Spin coating process to leave a thin layer on the surface. The circles indicate ACC particles and prenucleation clusters, while the rhombuses indicate CaCO3 crystalline particles. (D) Sketch of the GIWAXS setup. The dots and arcs on the 2D detector represent diffraction signals from highly and weakly oriented crystallites, respectively.

