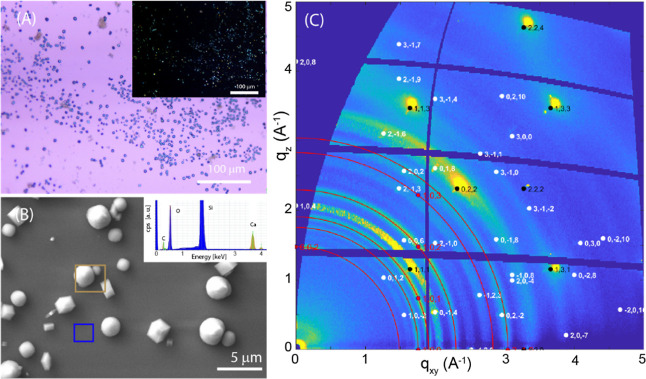
Figure 2.
Control experiment on formation of CaCO3 on the surface of a silicon wafer without SOM added. (A) Optical microscopy image and (inset) crossed-polarizer optical microscopy image. (B) SEM image of the sample. The inset reports the EDX spectra of the regions inside the squares according to the colors. (D) 2D-GIWAX image in which the red Debye rings indicate the diffraction effects from vaterite, the white spots are the Bragg peaks from calcite and those black from the silicon substrate. All the diffraction peaks come from vaterite, calcite, and silicon substrate and were indexed according to crystalline structure.43

