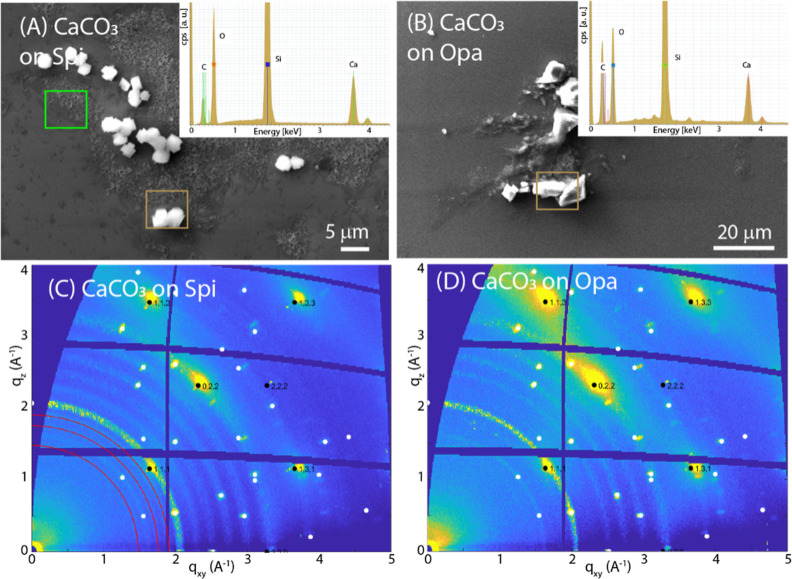
Figure 4.
(A,B) SEM images of CaCO3 deposited on the SOM layer from S. pistillata or O. patagonica, respectively. In the inset, the EDX spectra recorded from the square regions drawn on the SEM images are reported. (C,D) GID images from CaCO3 deposited on the SOM layer from S. pistillata or O. patagonica, respectively.

