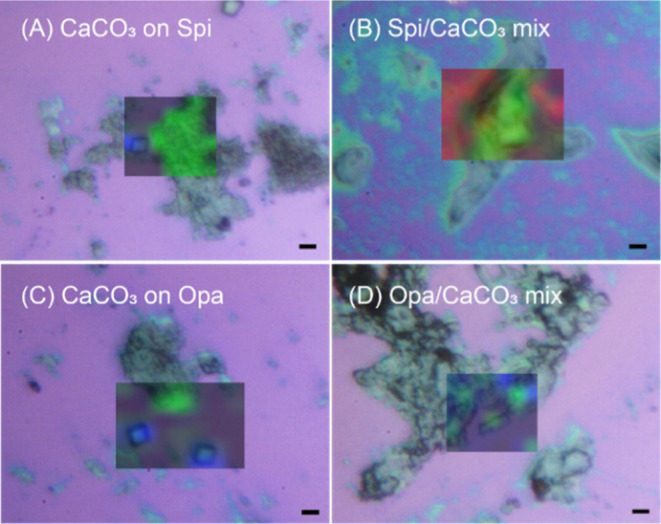
Figure 6.

Micro-Raman microscopy analyses on CaCO3 deposited on silicon substrates by sequential or mixing experiments showing optical microscopy images and CaCO3 phase overlaid color Raman maps. (A,B) CaCO3 deposited on the Spi SOM substrate from a CaCO3 dispersion (A) and on the silicon substrate from a Spi SOM–CaCO3 mixture (B). (C,D) CaCO3 deposited on the Opa SOM substrate from a CaCO3 dispersion (C) and on the silicon substrate from an Opa SOM–CaCO3 mixture (D). In the overlaid color Raman map, green indicates ACC and blue indicates calcite. The red background is due to the silicon substrate. The mineral phases were assigned according with previous studies.33,34 Scale bar: 4 μm.
