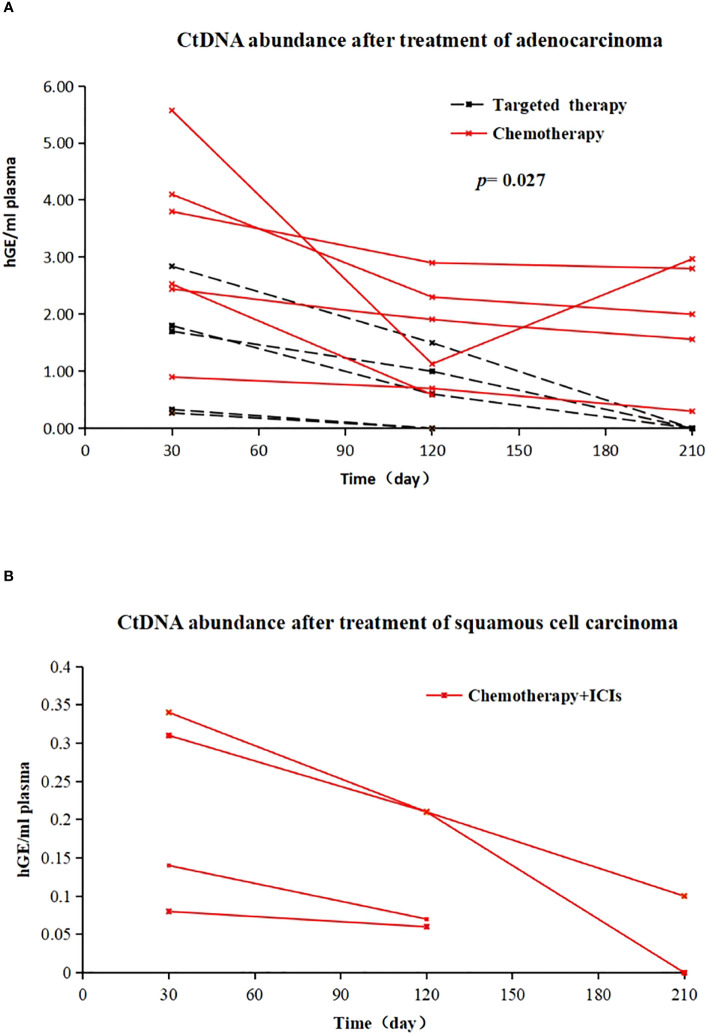
Figure 4.
(A) Changes in ctDNA abundance after EGFR-TKI treatment (dotted line) and chemotherapy (solid line) in 11 postoperative MRD-positive adenocarcinoma patients; X-axis represents follow-up time, Y-axis represents ctDNA abundance; (B) in vivo tumour ctDNA abundance in 4 patients with MRD-positive squamous cell carcinoma treated with chemotherapy + ICIs; X-axis represents follow-up time, Y-axis represents ctDNA abundance.

