4.
All‐cause mortality.
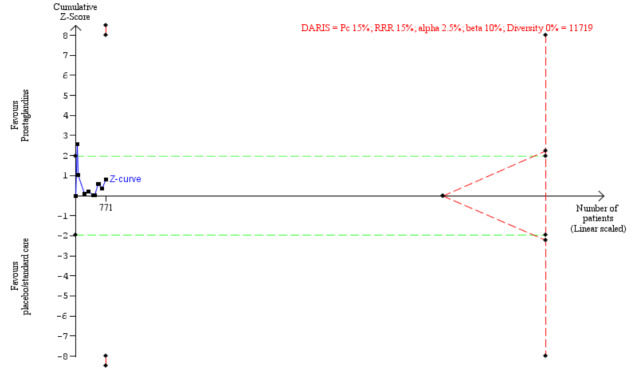
The Trial Sequential Analysis results showed that the Trial Sequential Analysis adjusted 95% CI of risk ratio (RR), using the random‐effects model, was 0.87 (95% CI 0.21 to 3.59), and the diversity‐adjusted required information size (DARIS) for detecting an intervention effect was 11,719 participants. The blue line (Z‐curve) shows the cumulative z value (771 participants). The horizontal green dotted lines show the threshold for significance in conventional meta‐analysis, at 1.96 of the Z‐value, corresponding to the P‐value of 0.05. The red lines, at the left top and bottom corners, show the trial sequential boundaries for benefit or harm, representing the threshold for statistical significance in the TSA. The red dotted triangular shape to the right shows the futility boundaries and futility area of the TSA.

