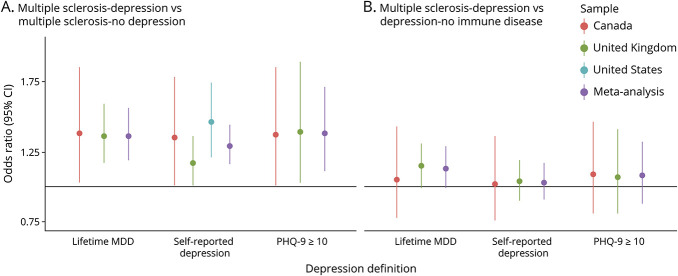
Figure 1. Multivariable Logistic Regression Analyses Investigating the Association Between the Depression Polygenic Score With MS and Comorbid Depression Compared With (A) MS and No Depression or (B) Depression With No Comorbid Immune Disease.
Each depression definition is assessed as a separate model including the polygenic scores for depression and BMI, the first 5 genetic ancestry principal components, age, and sex. BMI polygenic score results are reported in Table 3. Data represented as odds ratio and 95% CI. Random-effect inverse variance-weighted model was used for self-reported depression (heterogeneity A: I2 = 41.0%, B: I2 = 0%), whereas the other meta-analytic results used a fixed-effect model (heterogeneity lifetime MDD A: I2 = 0%, B: I2 = 38.5%; PHQ-9 ≥10 A: I2 = 0%; B: I2 = 43.2%). This figure visualizes the content of eTable 3 (links.lww.com/WNL/C885). BMI = body mass index; MDD = major depressive disorder; MS = multiple sclerosis; PHQ-9 = Patient Health Questionnaire-9.

