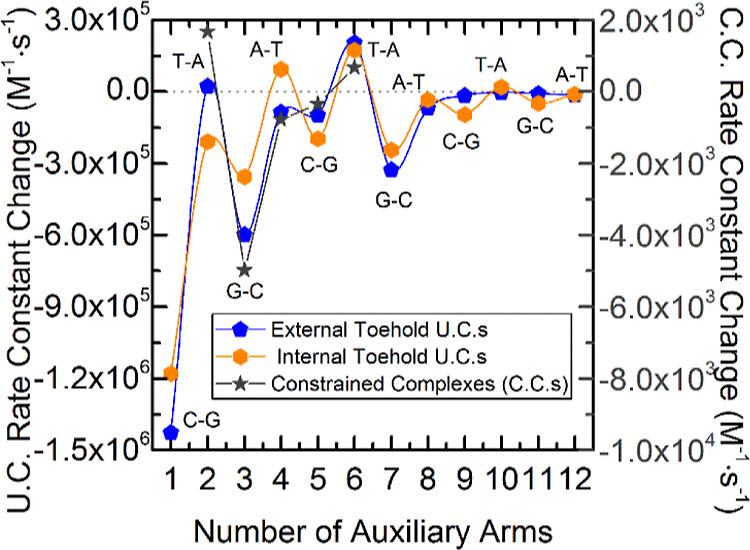
Figure 5.

Difference of the rate constants with an increasing number of auxiliary arms for both U.C. (left scale) and C.C. (right scale). Plot labels indicate the base pair of each arm closest to the junction to show the similarity in the trends. The rate constant change values are relative to the complexes with one less arm. For example, the rate constant change shown at one auxiliary arm is compared to complexes with no auxiliary arms. Blue pentagons show the decreases of rate constants of unconstrained external toehold complexes, while orange hexagons show the decrease of unconstrained internal toehold complexes, and dark gray stars depict the rate constant decreases of C.C.s. There is a noticeable swing of big decreases and small decreases which in some cases (two and six auxiliary arms) turn into mild increases of the rate constant with increasing numbers of arms. This pattern is remarkably consistent among all three sets of complexes.
