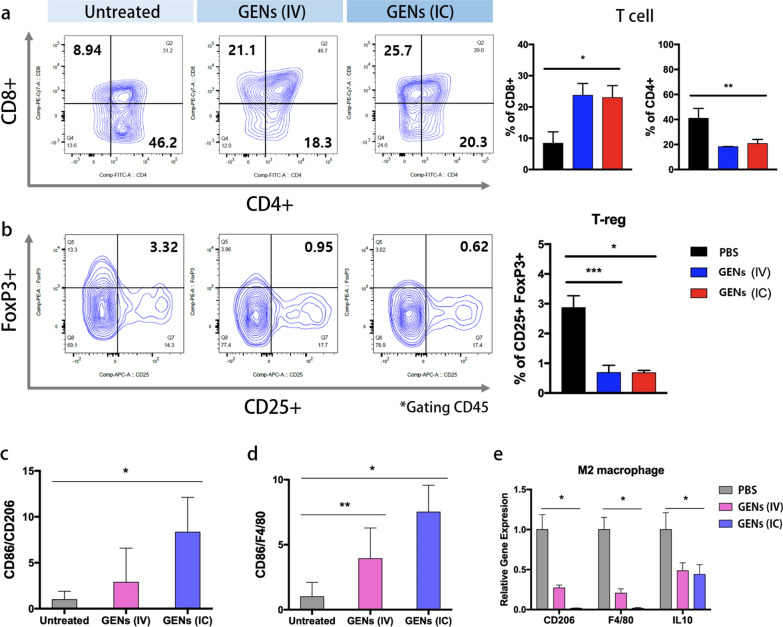
Fig. 8.
T cells and regulatory T cells (Tregs) are induced by decreased cytokines in the tumor microenvironment (TME). a Analysis of regulation of T cells. Fluorescently conjugated anti-CD8, CD4, and CD45 monoclonal antibodies were used to analyze T cells. The abundance of CD8 of T cells, gated CD45, was increased in the GENs treatment groups, whereas the abundance of CD4 was decreased compared to the PBS group. b Fluorescently conjugated anti-FoxP3, CD25, and CD45 monoclonal antibodies were used to analyze Tregs. Tregs cell population was evaluated by FACS analysis. The abundance of Tregs was reduced in the GENs treatment groups. c–e The ratio of the relative gene expressions of M1 and M2 (*, P < 0.05; **, P < 0.01; ***, P < 0.001)

