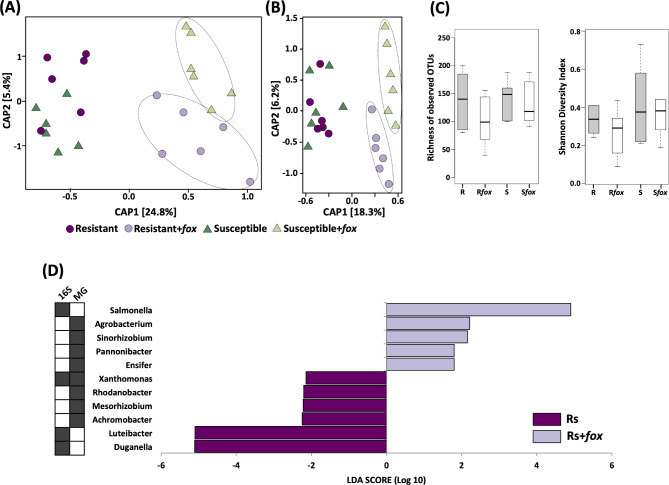
Fig. 5.
Structure, diversity and composition of the endosphere bacterial community from two common bean cultivars non-inoculated or inoculated with Fusarium oxysporum (fox). Principal coordinate analysis (CAP) comparing the endophytic community using (A) 16S rRNA and (B) metagenome data. Significant clusters (PERMANOVA, P < 0.05) are indicated by lines in the CAP graphs. (C) Diversity measurements for the endophytic community. Asterisks in the diversity graphs indicate signifcant differences based on Tukey’s test (P < 0.05). (D) Linear discriminant analysis (LDA) Effect Size (LEfSe) of microbial taxa enriched after fox inoculation in the endophytic community of the fox-resistant cultivar at genus level. Filled squares at the left side of the graphs indicate the datasets were the differential taxa were found. R = fox-resistant cultivar; Rfox = fox-resistant cultivar infected; S = susceptible cultivar; Sfox – susceptible cultivar infected; Bulk = bulk soil

