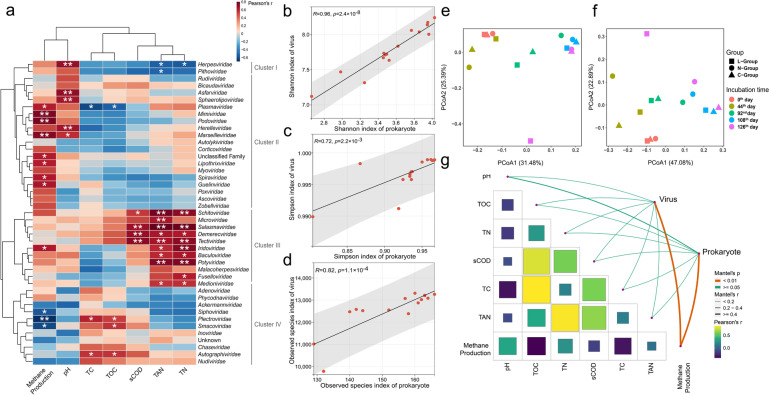
Fig. 3.
Dynamics of viruses and prokaryotes during cultivation. a Relationships between viral taxa and physicochemical parameters were calculated by Pearson correlation. Asterisks show significance, where p < 0.05 is indicated by* and p < 0.01 is indicated by **. Pearson’s correlations for b Shannon indexes, c Simpson indexes, and d observed species indexes between viruses and prokaryotes. PCoA of e viruses and f prokaryotes derived from Bray-Cutis dissimilarities was performed using the TPM values. The ANOSIM test was applied to assess the differences among sample dates. g Pairwise comparisons of the biotic and physicochemical parameters using the Mantel test. Heatmap indicates Pearson correlations between pairwise abiotic factors

