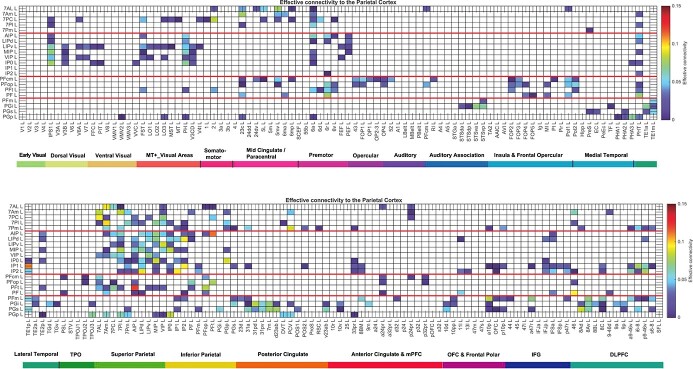
Fig. 2.
Effective connectivity TO the posterior parietal cortex (the rows) FROM 180 cortical areas (the columns) in the left hemisphere. The effective connectivity is read from column to row. Effective connectivities of 0 are shown as blank. All effective connectivity maps are scaled to show 0.15 as the maximum, as this is the highest effective connectivity found between this set of brain regions. The effective connectivity algorithm for the whole brain is set to have a maximum of 0.2, and this was for connectivity between V1 and contralateral V1. The effective connectivity for the first set of cortical regions is shown in the top panel; and for the second set of regions in the lower panel. Abbreviations: see Table S1. The four groups of posterior parietal cortex areas are separated by red lines. Group 1: the superior parietal cortex is above the top red line. Group 2: the intraparietal cortex is below the top red line. Group 3: the mainly somatosensory inferior parietal cortex regions is next. Group 4: the mainly visual inferior parietal cortex regions is below the lowest red line.

