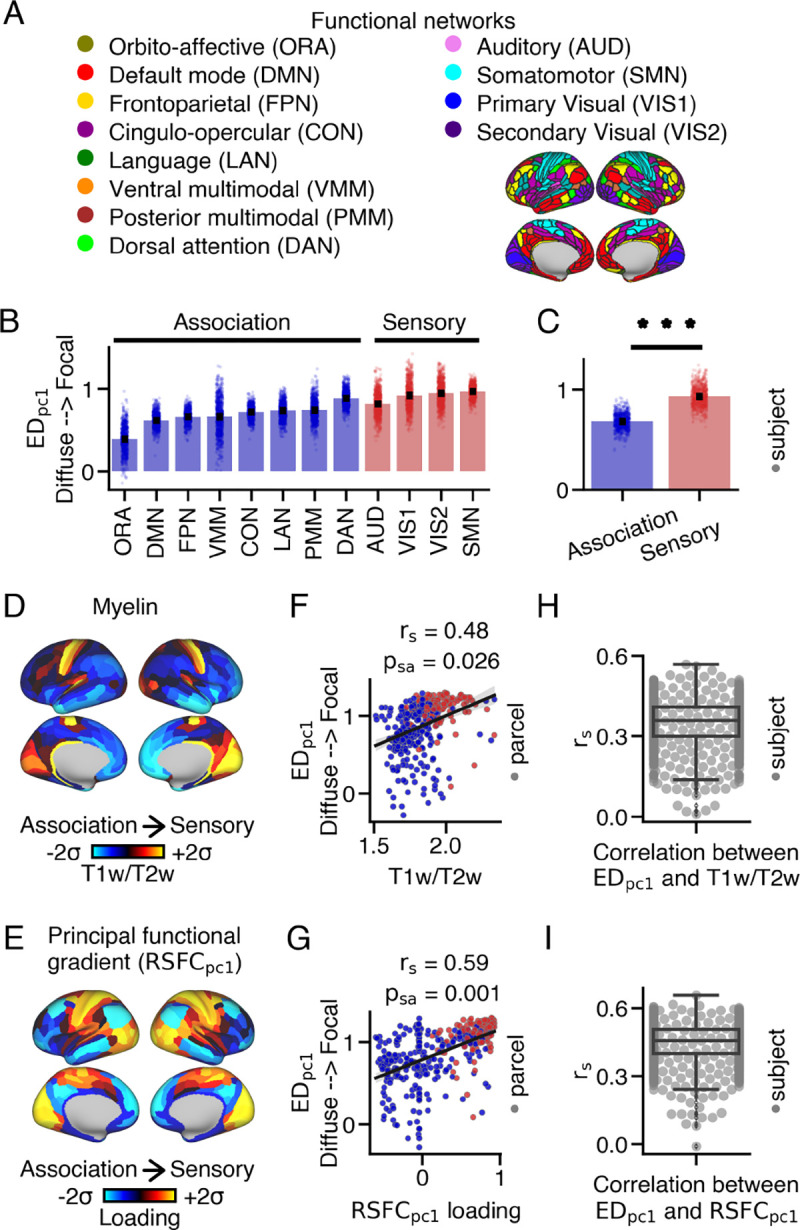
Fig. 2.

Differences in thalamic connectivity patterns between sensory and association cortical parcels. (A) Resting-state functional connectivity networks identified by Ji et al. (45). The 360 cortical parcels were assigned to twelve functional networks, including eight association and four sensory networks. (B) loadings for each network, representing the average loading within the network for each subject. Barplots show the mean and standard error. (C) Sensory networks exhibited significantly higher loadings compared to association networks (two-sided Wilcoxon signed-rank test; *** p < 0.001). (D) Cortical myelin map calculated by averaging T1w/T2w values across subjects. (E) Cortical principal functional gradient loading () map derived from PCA on cortico-cortical resting-state functional connectivity data. Sensory cortical parcels displayed higher T1w/T2w values and loadings compared to association cortical parcels. (F,G) Correlations between loadings and T1w/T2w values, as well as loadings, across the cortex. (H,I) On average, a moderate relationship was observed between loadings and T1w/T2w values, as well as loadings, across subjects.
