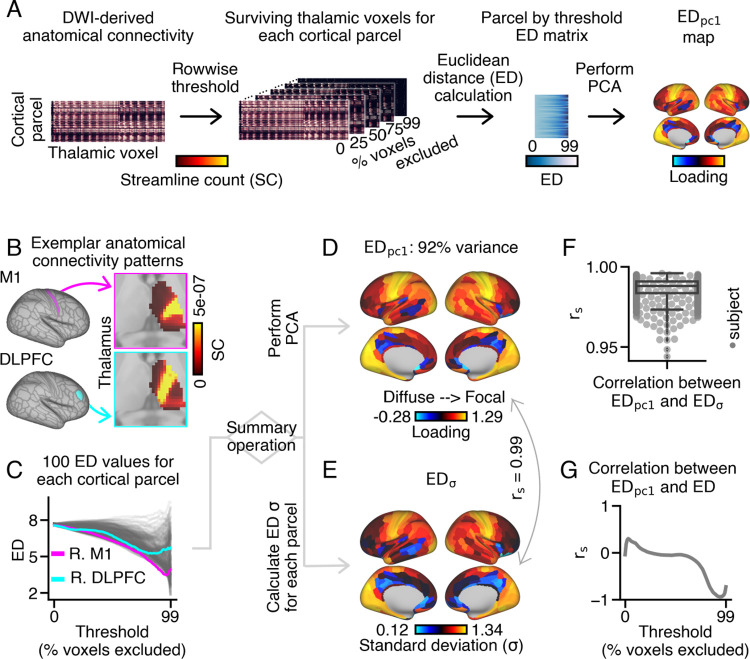
Fig. 1.
Workflow to quantify the extent of each cortical area’s thalamic anatomical connectivity pattern using Euclidean distance (ED). (A) Schematic overview of the thresholding and ED calculation framework applied to group-averaged and individual-level human probabilistic tractography data (). ED was used to measure the extent of each cortical area’s anatomical connectivity pattern within ipsilateral thalamus (see Fig. S7 for bilateral calculation). (B) Thalamic connectivity patterns for right motor area 1 (M1) and dorsolateral prefrontal cortex (DLPFC). M1 and DLPFC exhibit focal and diffuse thalamic connections, respectively. Cortical parcels were defined via Glasser et al. (45). (C) ED matrix, depicting average pairwise distances between surviving thalamic voxels for 100 thresholds. Cortical parcels with more diffuse thalamic connections exhibited higher ED values across thresholds (e.g., DLPFC). (D) Cortical loading map obtained by applying principal component analysis (PCA) to the ED matrix. (E) Cortical map showing the standard deviation of ED across 100 thresholds for each cortical parcel. almost perfectly correlated with ), with p-values estimated using spatial-autocorrelation (sa) preserving surrogate brain maps (46). : Spearman rho. (F) Correlations between and were highly consistent across subjects. (G) loadings and ED values across cortex negatively correlated at more conservative thresholds, indicating that higher loadings correspond to more focal thalamic connections.

