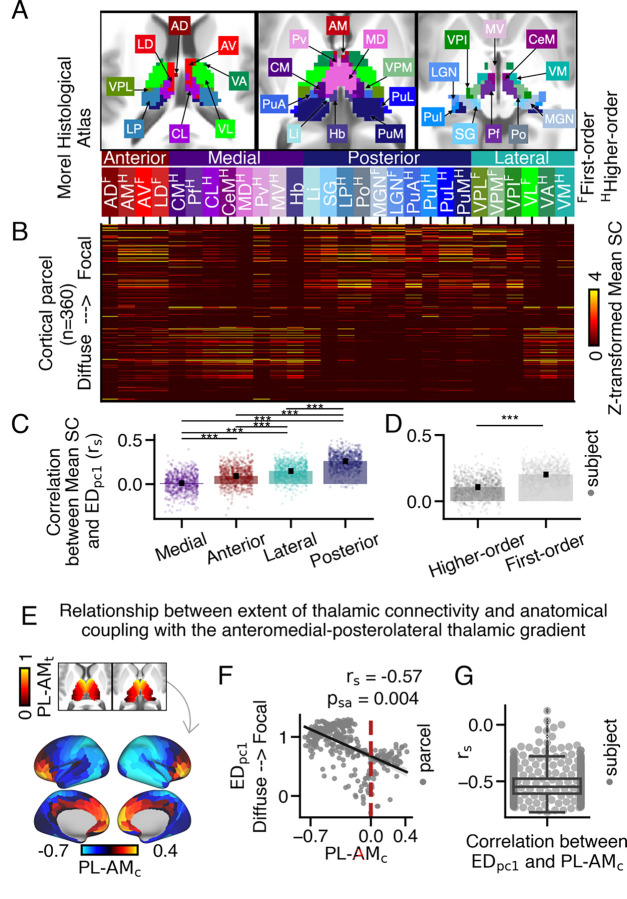
Fig. 3.
Mapping between the spatial extent of anatomical connections within the thalamus and anatomical coupling with the anteromedial-posterolateral thalamic gradient. (A) Axial view of 28 histologically-defined thalamic nuclei from the Morel thalamic atlas (57). (B) Anatomical connectivity matrix depicting the anatomical connectivity strength between each cortical parcel and each thalamic nucleus. The y-axis is sorted such that cortical parcels with higher loadings are positioned near the top. (C-D) The correlation between loadings and Mean SC values was calculated for each thalamic nucleus for each subject. Higher values indicate thalamic nuclei that preferentially couple with cortical parcels with focal thalamic connections. (C) Posterior thalamic nuclei preferentially coupled with cortical parcels with focal thalamic connections, relative to lateral, anterior, and medial nuclei (Friedman test; for Nemenyi post-hoc tests). Each dot represents a subject’s averaged value across nuclei within the subclass. (D) First-order thalamic nuclei preferentially coupled with cortical parcels with focal thalamic connections (two-sided Wilcoxon signed-rank test). (E) The overlap between each cortical parcel’s anatomical connectivity along the anteromedial-posterolateral thalamic spatial gradient (). Positive values denote preferential coupling with anteromedial thalamus, while negative values denote preferential coupling with posterolateral thalamus (). (F) Cortical parcels with higher loadings preferentially coupled with the posterolateral thalamus, reflected by lower values. (G) On average, a moderate relationship was observed between loadings and values across subjects.

