Fig. 4.
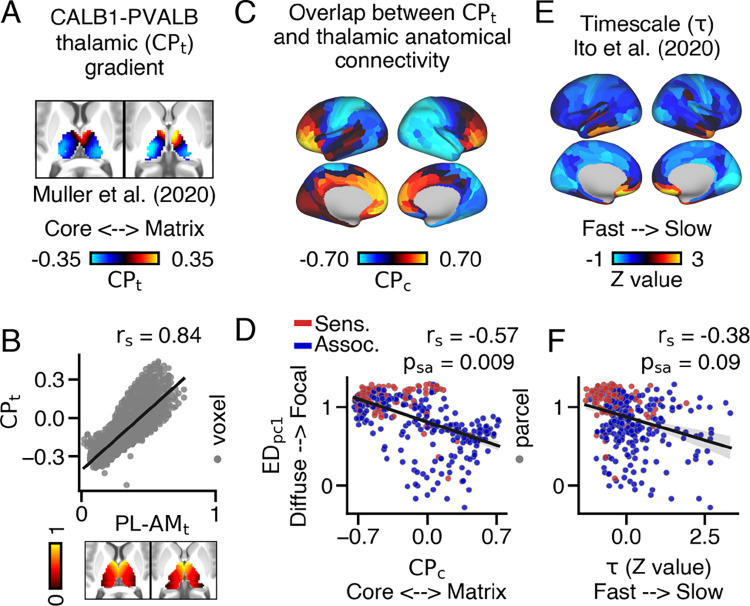
Mapping between cortical variation in the extent of thalamic connectivity patterns, anatomical overlap across thalamic subpopulations, and intrinsic timescale. (A) Thalamic gradient reflecting the relative mRNA expression of Parvalbumin (PVALB) and Calbindin (CALB1)-expressing thalamic subpopulations (), which index ‘core’ and ‘matrix’ thalamic subpopulations respectively. (64). Warmer colors reflect higher CALB1 expression relative to PVALB. (B) and values strongly correlated with one another. (C) Cortical map reflecting each cortical area’s anatomical overlap across values (). Warmer colors reflect preferential coupling with CALB1-expressing thalamic populations and cooler colors reflect preferential coupling with PVALB-expressing thalamic populations. (D) loadings and values significantly correlated with one another. (E) Cortical map of z-transformed intrinsic timescale (), calculated from group-averaged resting-state data (65). (F) loadings and z-transformed values exhibited a trending correlation when accounting for spatial-autocorrelation.

