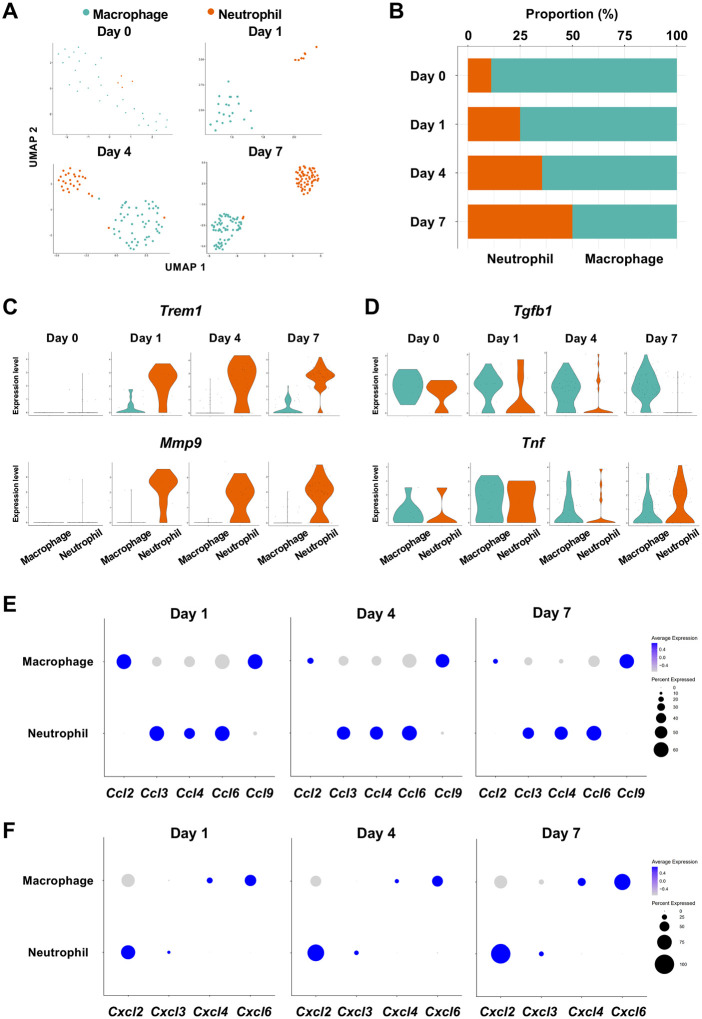
Figure 5.
Myeloid cell composition and activity in gingival tissue during in periodontitis development. (A) t-SNE projection plots showing myeloid cell subpopulations in gingival tissue during periodontitis development on Days 0, 1, 4, and 7. Colors indicate cell type, as follows: green, macrophages and red, neutrophils. (B) Proportion plots showing the relative amounts of neutrophils and macrophages on Days 0, 1, 4, and 7. (C) Violin plots showing Trem1 and Mmp9 expression levels in myeloid cells on Days 0, 1, 4, and 7; both genes are upregulated in neutrophils after ligature placement. (D) Violin plots showing Tgfb1 and Tnf expression in myeloid cells on Days 0, 1, 4, and 7; no obvious induction is observed in response to ligature placement. (E) Dot plots depicting expression levels of the C motif chemokine ligand (CCL) genes Ccl2, Ccl3, Ccl4, Ccl6, Ccl9. (F) The expression of CXC motif chemokine ligand (CXCL) genes Cxcl2, Cxcl3, Cxcl4, and Cxcl9. Chemokine expression in myeloid cells was unrelated to progression of gingival inflammation from Day 1 to 7.

