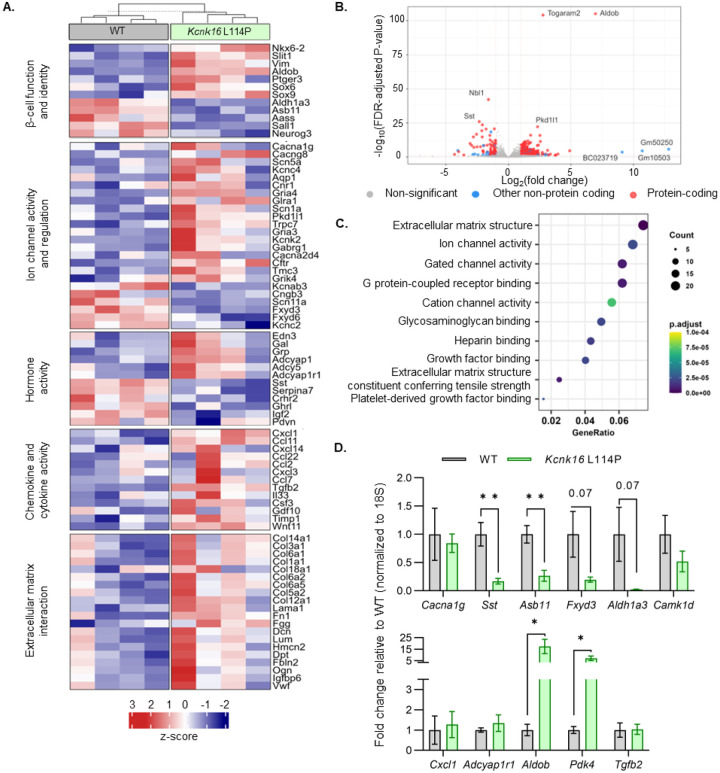
Figure 6. Kcnk16 L114P islets exhibit altered expression of genes involved in β-cell identity and function, ion channel activity, hormone activity, inflammatory signaling, and extracellular matrix interaction pathways.
A. Heatmap of a selected gene subsets showing differential gene expression in WT and Kcnk16 L114P islets. Normalized expression levels were scaled and centered by rows. B. Volcano plot displays genes differentially expressed between WT and Kcnk16 L114P samples. Differentially expressed genes are defined by FDR <0.05 and log2FC (≥1). C. Dotplot represents the top 10 most significantly (FDR <0.05) altered Gene Ontology (Molecular Function). GeneRatio represent (count of enriched genes) / (count of genes in the GO term). The color represents FDR adjusted p-values and the size of the dot represents the number of genes that are significant from the experimental dataset. D. qRT-PCR validation of the gene expression differences in WT and Kcnk16 L114P samples for the selected genes observed through bulk-sequencing.

