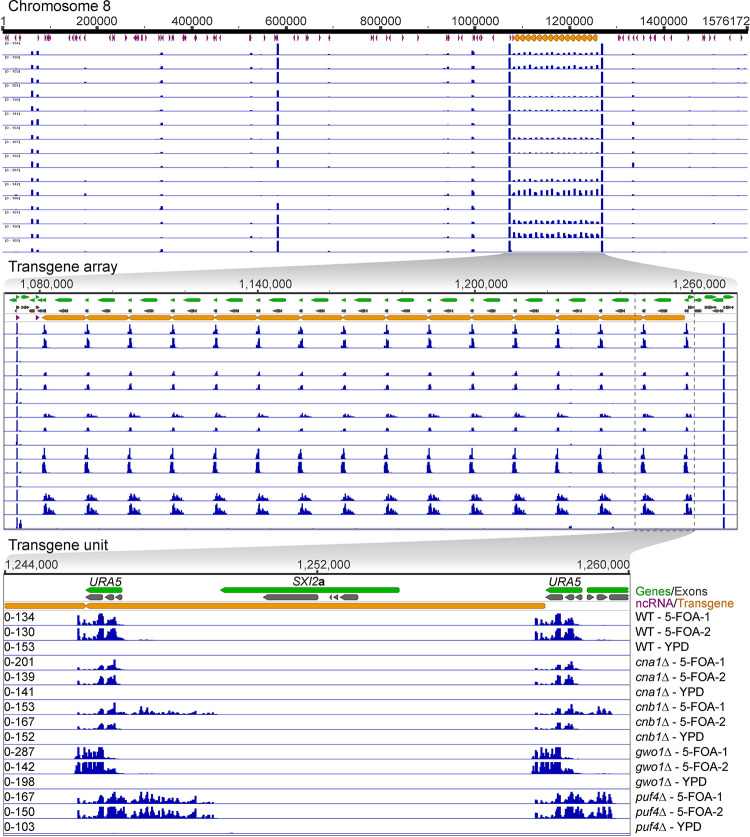
Figure 4. Calcineurin mutants produce less siRNA against the transgene array.
A series of genomic location maps showing the status of siRNA against the transgene array is presented with the top panel showing the full chromosome 8 on which the transgene array is integrated. The middle panel shows a zoomed view of the entire transgene array and mapping of siRNA from the wild-type as well as various mutants. The lower panel depicts a single unit of transgene array including the location of URA5 and SXI2a genes. URA5 outside of the transgene array represents the endogenous copy of URA5 that was targeted for transgene insertion. The mapped siRNA data is presented in the same order across all three panels and is labeled in the lower panel. The siRNA mapping revealed a lower level of siRNA in both cna1Δ and cnb1Δ mutants whereas a difference in siRNA distribution was observed in gwo1Δ and puf4Δ mutants.

