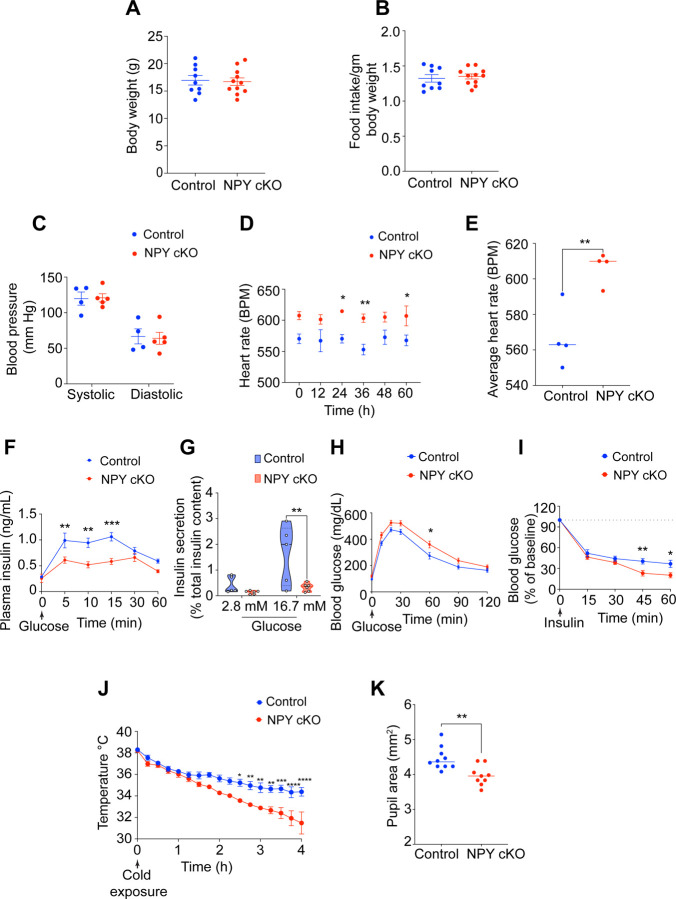
Figure 5. NPY cKO mice show metabolic and cardiovascular defects.
(A, B) Body weight (A) and food intake (B) are comparable between NPY cKO and control mice. Results are means ± s.e.m from n=9 control and 11 mutant mice, unpaired t-test. (C) Systolic and diastolic blood pressures are normal in NPY cKO mice. Results are means ± s.e.m from n= 4 control, and 5 mutant mice, unpaired t-test. (D, E) NPY cKO mice show elevated heart rate, compared to control animals. ECGs were recorded continuously in conscious mice for 7 days, although only data for 4th-7th days after insertion of lead implants are included in the analysis. Results are presented as means ± s.e.m from n= 4 mice per genotype. *p< 0.05; **p<0.01, two-way ANOVA, Sidak’s multiple comparisons tests for (D) and unpaired t-test for (E). (F) NPY cKO mice show reduced plasma insulin levels in response to a glucose challenge (i.p. injection of 3g/kg glucose after 16 hr fast) compared to control mice. Results are means ± s.e.m from n=12 control, 8 mutant mice. **p<0.01; ***p<0.001; two-way ANOVA, Sidak's multiple comparisons tests. (G) Glucose-stimulated insulin secretion is reduced in isolated islets from NPY cKO mice relative to control animals. Islets were isolated from n= 5 control, n=6 mutant mice, p**<0.01; two-way ANOVA, Tukey's multiple comparisons tests. (H) NPY cKO mice show impaired glucose tolerance. Results are means ± s.e.m from n=12 control and 17 mutant mice. *p<0.05; two-way ANOVA, Sidak's multiple comparisons tests. (I) Improved insulin sensitivity in NPY cKO mice compared to control animals. Data are means ± s.e.m from n=7 control, 6 mutant. *p<0.05; **p<0.01; two-way ANOVA, Sidak's multiple comparisons tests. (J) NPY cKO mice show impaired cold tolerance compared to control animals. Body temperatures were first recorded at room temperature (~26°C), after which mice were moved to 4°C and body temperatures were measured every 15 min for 4 hr. Results are mean ± s.e.m from n=5 mice per genotype. *p<0.05; **p<0.01; ***p<0.001; ****p<0.0001; two-way ANOVA, Sidak's multiple comparisons tests. (K) Dark-adapted NPY cKO mice have decreased basal pupil area compared to control mice. n=10 control, n=9 mutant mice. **p<0.01; unpaired t-test.

