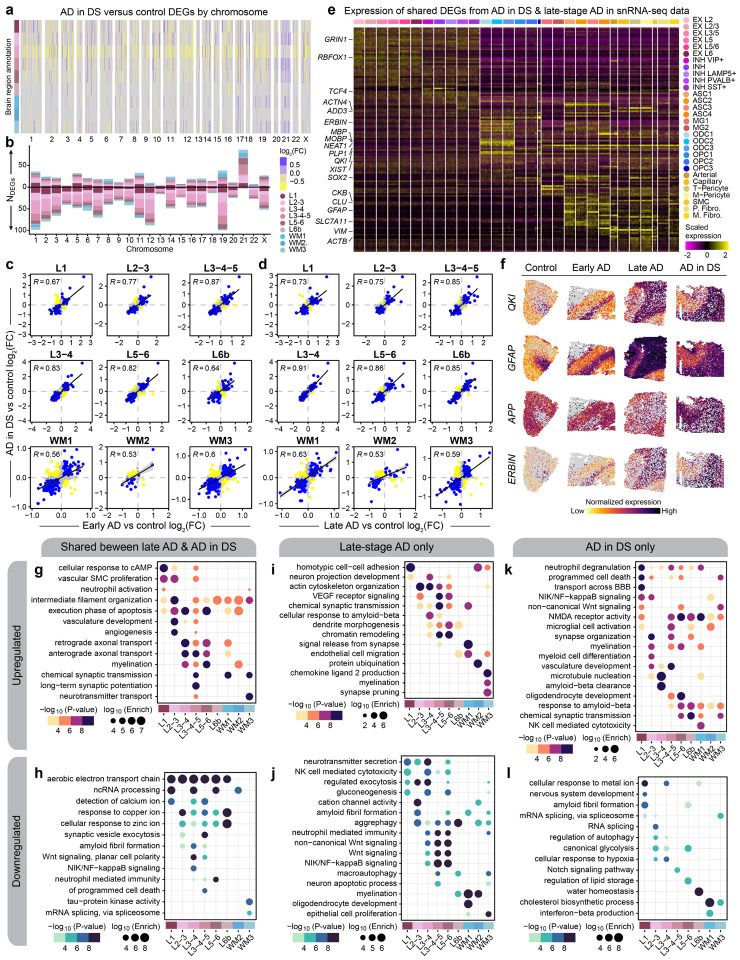
Figure 2. Shared and distinct gene expression signatures among subtypes of AD.
a, Heatmap colored by effect size from the AD in DS versus control differential gene expression analysis, with genes stratified by chromosome and by spatial region. Statistically significant (FDR < 0.05) genes with an absolute average log2(fold-change) >=0.25 in at least one region are shown. b, Stacked bar chart showing the number of AD in DS versus control DEGs in each spatial region stratified by chromosome. c, Comparison of differential expression effect sizes from early-stage AD versus control and AD in DS versus control. Genes that were statistically significant (adjusted p-value < 0.05) in either comparison were included in this analysis. Genes are colored blue if the direction is consistent, yellow if inconsistent, and grey if the absolute effect sizes were smaller than 0.05. Black line represents a linear regression with a 95% confidence interval shown in grey. Pearson correlation coefficients are shown in the upper left corner of each panel. d, Comparison of differential expression effect sizes from late-stage AD versus control and AD in DS versus control, layout as in panel (c). e, Heatmap showing the gene expression values in the snRNA-seq dataset of spatial DEGs shared between AD in DS and late-stage AD. f, Spatial feature plots of four selected DEGs (QKI, GFAP, APP, and ERBIN) in one representative sample from each disease group. g-h, Selected pathway enrichment results from DEGs that were upregulated (g) or downregulated (h) in both late-stage AD and AD in DS compared to controls. i-j, Selected pathway enrichment results from DEGs that were upregulated (i) or downregulated (j) in late-stage AD exclusively. k-l, Selected pathway enrichment results from DEGs that were upregulated (k) or downregulated (l) in AD in DS exclusively.

