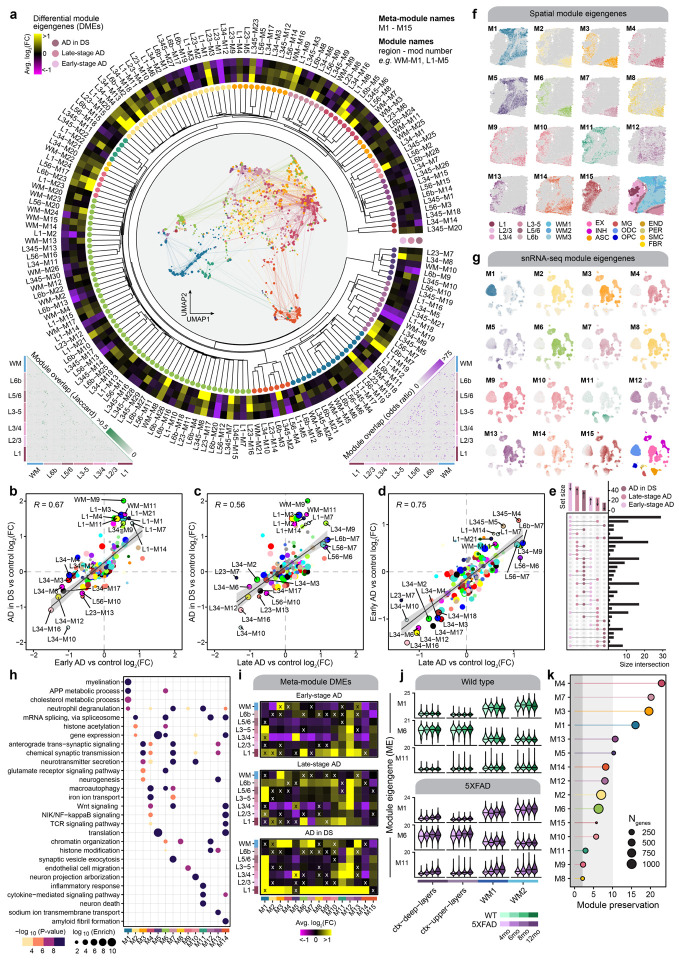
Figure 3. Multi-scale spatial co-expression network analysis reveals systems-level transcriptome alterations in AD.
a, Dendrogram shows the of partitioning 166 gene co-expression modules into 15 brain-wide meta-modules. Network plot in the center represents a consensus co-expression network constructed from grey matter cortical clusters and white matter, where each dot represents a gene colored by meta-module assignment. Heatmap shows effect sizes from differential module eigengene (DME) testing in early-stage AD, late-stage AD, and AD in DS compared with controls. Triangular heatmaps show measures of distance between modules (bottom left: Jaccard index, bottom right: odds ratio). b-d, Comparison of effect sizes from differential module eigengenes testing in early-stage AD and AD in DS (b), late-stage AD and AD in DS (c), and late-stage AD and early-stage AD (d). Each dot represents a gene co-expression module, and selected modules are labeled. Black line represents a linear regression with a 95% confidence interval shown in grey. Pearson correlation coefficients are shown in the upper left corner of each panel. e, Upset plot showing the overlap between sets of differentially expressed modules in each disease group. f, Spatial expression profiles (module eigengenes, MEs) of the 15 meta-modules in one representative sample. Darker color corresponds to higher expression levels. A spatial plot with each spot colored by cluster assignment is shown in the bottom right corner as a visual aid. g, UMAP feature plots showing MEs of the 15 spatial meta-modules projected into the snRNA-seq dataset. Darker color corresponds to higher expression levels. The UMAP plot colored by major cell type is shown in the bottom right corner as a visual aid. h, Selected pathway enrichment results for each meta-module. i, Heatmaps showing the meta-module DME results for each cortical layer and white matter in the early-stage AD (top), late-stage AD (middle), and AD in DS (bottom) samples compared to controls. DME tests were performed similarly to those shown in panel (a). X symbol indicates that the test did not reach statistical significance. j, Violin plots showing MEs of selected meta-modules (M1, M6, and M11) in the 5xFAD mouse dataset, split by age group, with black line indicating the median ME. k, Lollipop plot showing module preservation analysis of the meta-modules projected into the 5xFAD mouse dataset. Z-summary preservation > 10: highly preserved; 10 > Z-summary preservation > 2: moderately preserved; 2 > Z-summary preservation: not preserved.

