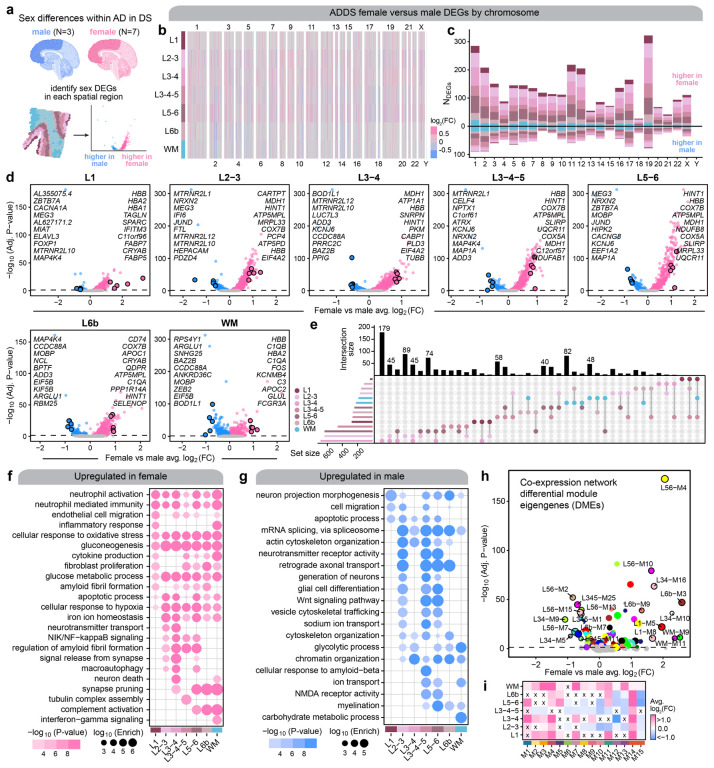
Figure 4. Sex differences within the AD in DS cohort.
a, We performed differential expression analyses between female and male samples for each spatial cluster within the AD in DS cohort for our ST dataset. Since we had more female than male samples in the ST dataset, we subsampled the ST spots in the female samples to match the number from the male samples (Methods). b, Heatmap colored by effect size from the AD in DS female versus male differential gene expression analysis, with genes stratified by chromosome and by spatial region. Statistically significant (FDR < 0.05) genes with an absolute average log2(fold-change) >= 0.25 in at least one region are shown. c, Stacked bar chart showing the number of AD in DS female versus male DEGs in each spatial region stratified by chromosome. d, Volcano plots showing the effect size and significance level from the AD in DS female versus male differential expression tests in each of the spatial clusters. The top 10 and bottom 10 significant genes by effect size are labeled, excluding the set of genes that are commonly DE among all the spatial clusters. e, Upset plot showing the overlap between sets of DEGs in each spatial clusters. f-g, Selected pathway enrichment analysis from DEGs that were upregulated in female (f) or in male (g). h, Volcano plot showing the effect size and significance level from the AD in DS female versus male differential module eigengene (DME) analysis, with the top 10 and bottom 10 modules labeled. i, Heatmap showing the meta-module AD in DS female versus male DME results for each cortical layer and white matter. DME tests were performed similarly to those shown in panel (h). X symbol indicates that the test did not reach statistical significance.

