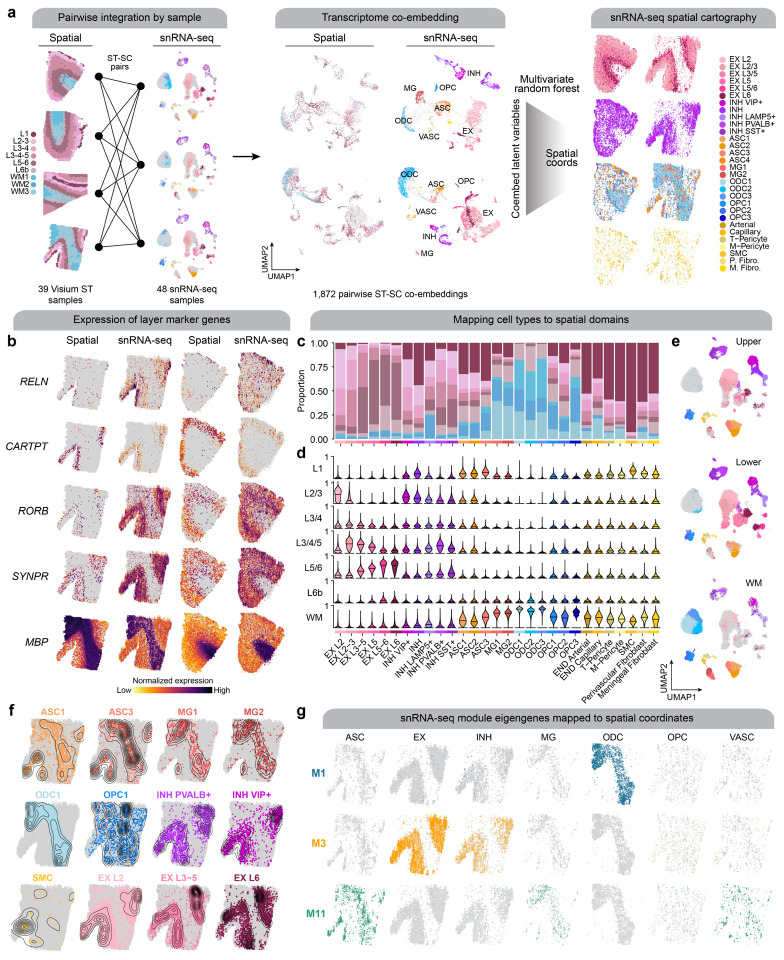
Figure 5. Systematic integration of spatial and single-nucleus expression profiles.
a, We performed a systematic pairwise integration of biological samples profiled with spatial and single-nucleus transcriptomics (left). For all possible pairs of ST + snRNA-seq samples, we constructed a transcriptomic co-embedding (middle), and then we used a multivariate random forest model (CellTrek56) to predict the spatial coordinates of each snRNA-seq cell in the given spatial context. The snRNA-seq dataset is shown on the right projected into two different spatial contexts (left: control sample; right: AD in DS sample), split by major cell lineages and colored by cell annotations. b, Spatial feature plots of selected layer-specific marker genes, shown side-by-side in the ST dataset and the snRNA-seq dataset projected into the spatial context for one AD in DS sample (left) and one control sample (right). c, Stacked bar plot showing the proportion of nuclei from each snRNA-seq cluster mapped to the spatial domains defined by the ST clustering. d, Violin plots showing the distribution of spatial domain mapping probabilities for nuclei from each of the snRNA-seq clusters. e, UMAP plot of the snRNA-seq dataset split by predicted spatial partitions into the upper cortical layers, lower cortical layers, or the white matter. f, Spatial density plot showing the snRNA-seq dataset in predicted spatial coordinates, highlighting selected cell populations. g, Spatial feature plots showing selected module eigengenes in the snRNA-seq dataset in predicted spatial coordinates.

