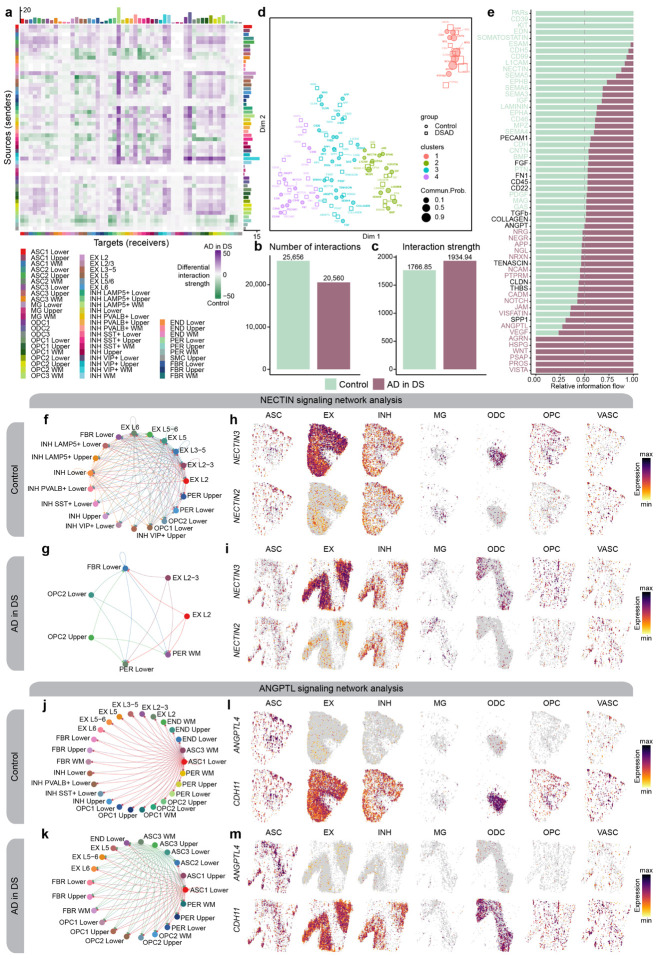
Figure 6. Altered cell-cell communication signaling networks in AD in DS.
a, Heatmap showing the differential cell-cell communication (CCC) interaction strength between AD in DS and control. Each cell represents a snRNA-seq cell population, where rows correspond to signaling sources and columns correspond to signaling targets. Bar plots on the top and right show the sum of the incoming and outgoing signaling respectively. b-c, Bar plots showing the total number of CCC interactions (b) and interaction strength (c) for control and AD in DS. d, Joint dimensionality reduction and clustering of signaling pathways inferred from AD in DS and control data based on their functional similarity. Each point represents a signaling pathway. e, Bar plots showing signaling pathways with significant differences between AD in DS and controls, ranked based on their information flow (sum of communication probability among all pairs of cell populations in the network). f-g, Network plot showing the CCC signaling strength between different cell populations in AD in DS (f) and controls (g) for the NECTIN signaling pathway. h-i, Spatial feature plots of the snRNA-seq in predicted spatial coordinates for one control sample (h) and one AD in DS sample (i) for one ligand and one receptor in the NECTIN pathway. j-k, Network plot as in panels (f-g) in AD in DS (j) and controls (k) for the ANGPTL signaling pathway. l-m, Spatial feature plots as in panels (h-i) for one control sample (l) and one AD in DS sample (m) for the ANGPTL pathway.

