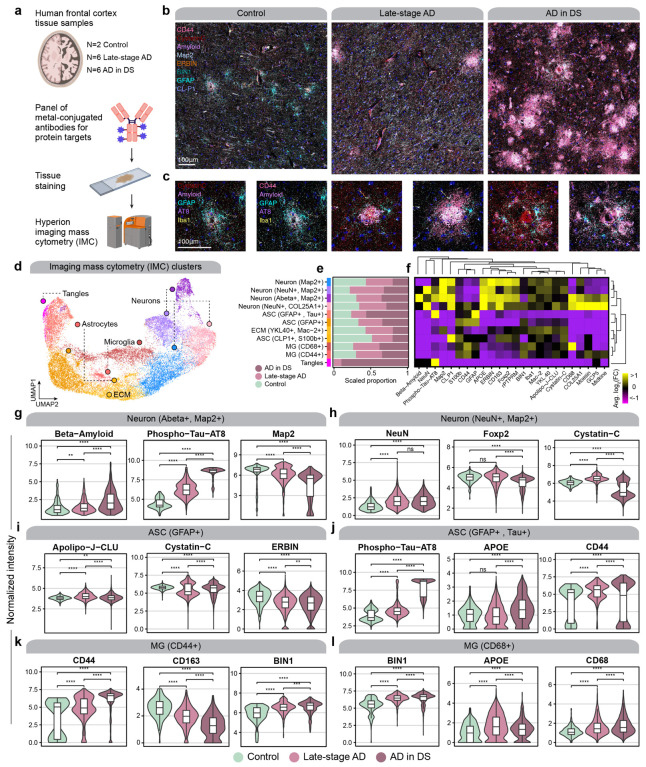
Figure 7. Imaging mass cytometry reveals spatial proteomic changes in AD.
a, We performed imaging mass cytometry (IMC) in postmortem human cortical tissue (n=2 control, n=6 late-stage AD, n=6 AD in DS) using the Standard BioTools Hyperion Imaging System. b, Representative IMC images from control, late-stage AD, and AD in DS samples with select targets from the panel. c, Images as in panel (b) at higher magnification and focused around amyloid plaques. d, UMAP plot showing the unbiased clustering of segmented nuclei from the IMC dataset based on their protein intensity values. Each dot represents a segmented nucleus, colored by cluster assignment. e, Stacked bar plots showing the proportion of segmented nuclei assigned to each cluster stratified by disease groups. f, Heatmap showing the relative protein intensity of each protein in each IMC cluster. Dendrograms depict hierarchical clustering results based on these relative intensities. g-l, Violin plots showing the distribution of protein intensities for selected proteins in specified IMC clusters, stratified by disease groups. Wilcox test comparison results are overlaid on each plot. Not significant (ns), p > 0.05; * p <= 0.05; ** p <= 0.01; *** p <= 0.001, **** p<= 0.0001.

