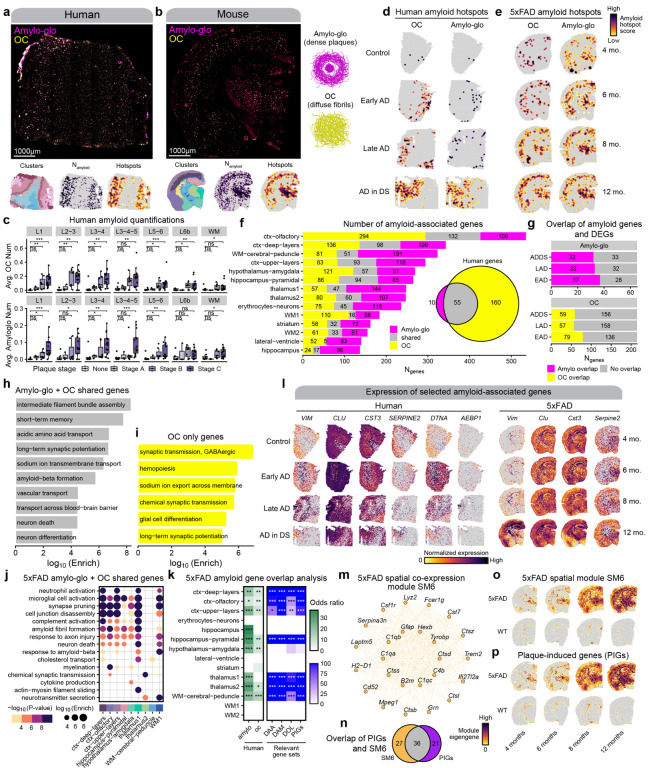
Figure 8. Identifying amyloid-associated gene expression signatures.
a-b, Representative fluorescent whole-section images from one AD in DS (a) and one 12-month 5xFAD sample (b) stained with Amylo-glo and OC to mark dense amyloid plaques and diffuse amyloid fibrils respectively. ST data colored by cluster (left), amyloid quantification (middle), and amyloid hotspot analysis (right) are shown below the images. c-d, Spatial feature plots showing the amyloid hotspot analysis results (Getis-Ord Gi* statistic) for the human (c) and mouse (d) ST datasets for OC (left) and Amylo-glo (right). e, Box and whisker plots showing the distribution of amyloid quantifications in the human ST dataset, stratifying samples by their neuropathological plaque staging. Box boundaries and line correspond to the interquartile range (IQR) and median, respectively. Whiskers extend to the lowest or highest data points that are no further than 1.5 times the IQR from the box boundaries. f, Stacked bar plot showing the number of amyloid-associated genes from Amylo-glo, OC, and shared for each of the mouse ST clusters. Euler diagram shows the number of Amylo-gloand OC-associated genes in the human dataset, and the overlap between these gene sets. g, Bar plots show the number of Amylo-glo- and OC-associated genes that overlap with disease DEGs. h-i, Selected pathway enrichment results from amyloid-associated genes that were shared between Amylo-glo and OC (h) and OC-specific (i) in the human ST dataset. j, Selected pathway enrichment results from amyloid-associated genes that were shared between Amylo-glo and OC for each cluster in the mouse ST dataset. k, Heatmap showing gene set overlap analysis results with the mouse amyloid-associated genes and human (left), and with other relevant gene sets (DAA: Disease-associated astrocytes44; DAM: Disease-associated microglia43; DOL: Disease-associated oligodendrocytes45; PIGs: Plaque-induced genes70). Fisher’s exact test results shown as follows: Not significant (ns), p > 0.05; * p <= 0.05; ** p <= 0.01; *** p <= 0.001, **** p<= 0.0001. l, Spatial feature plots of selected amyloid-associated genes in representative samples from the human (left) and mouse (right) ST datasets. m, Network plot showing module hub genes from the mouse spatial co-expression network module SM6. n, Euler plot showing the gene set overlap of the SM6 module and the PIGs module from Chen et al.70. o-p Spatial feature plots showing the module eigengenes for the SM6 module (o) and the PIGs module (p) in representative samples of the mouse ST dataset.

