FIGURE 1.
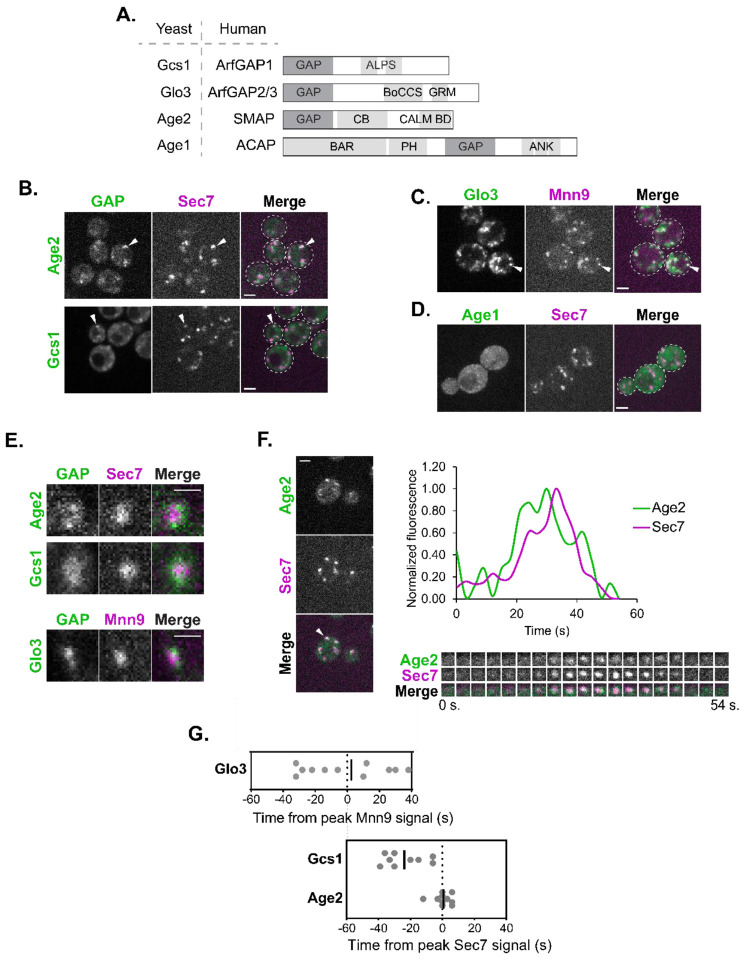
The Arf-GAPs Glo3, Gcs1, and Age2 localize at the early-, medial-, and late-Golgi respectively.
(A) Schematic of the yeast Arf-GAPs and their human homologs and domain structures. GAP, GAP domain; ALPS, Amphipathic Lipid Packing Sensor; BoCCS, Binding of Coatomer, Cargo and SNARE; GRM, Glo3 Regulatory Motif; CB, Clathrin Binding; CALM BD, CALM Binding Domain; BAR, Bin/Amphiphysin/Rvs; PH, Pleckstrin Homology Domain; ANK, Ankyrin Repeat. (B) Subcellular localization of Age2-GFP or Gcs1-GFP relative to the late-Golgi marker Sec7-6xDsRed. Arrowheads indicate colocalization between tagged proteins. Single focal plane. (C) Subcellular localization of Glo3-Neon relative to the early-Golgi marker Mnn9-mCherry. Arrowheads indicate colocalization between tagged proteins. Single focal plane. (D) Subcellular localization of endogenous Neon-tagged Age1. Maximum projection. (E) Magnified images showing the distribution of endogenously tagged GAPs (Age2-GFP, Gcs1-Neon, and Glo3-Neon) at single Golgi compartments (Mnn9-mCherry, early-Golgi, or Sec7-6xDsRed, late-Golgi). Scale bar represents 1 μm. (F) Left: Representative image of time-lapse microscopy of Age2-GFP versus Sec7-6xDsRed. Arrowhead denotes Golgi compartment of interest. Single focal plane. Bottom right: Imaging of the compartment of interest over time. Top right: Plot of normalized fluorescence intensity in the compartment of interest over time. (G) (Top) Peak-to-peak times (s) for Glo3 versus Mnn9 and (Bottom) for Gcs1 and Age2 versus Sec7. Line represents the mean. Offset between two graphs is for visual purposes, and was approximated based on time-lapse analyses reported in Sardana et al., 2021 and Tojima et al., 2019. For all images, scale bars represent 2 μm unless otherwise noted.

