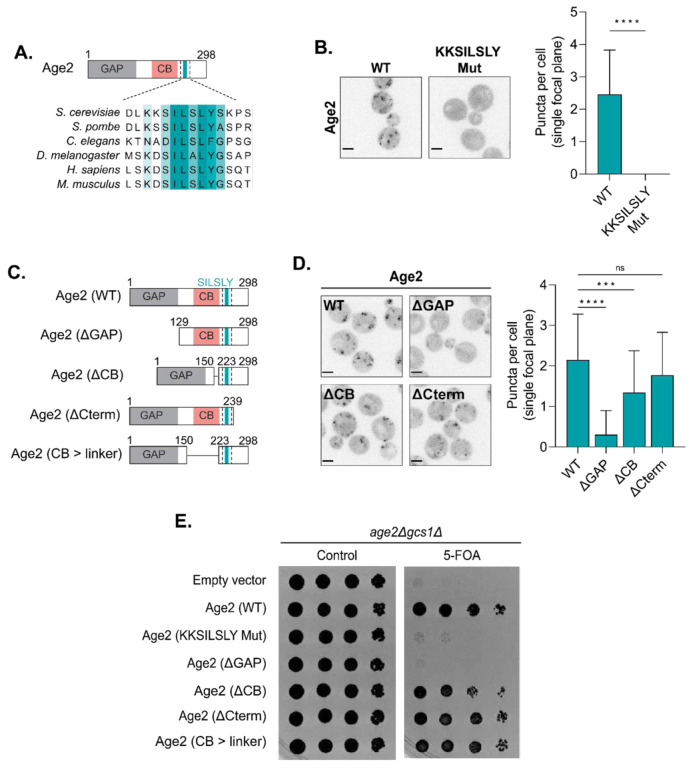
FIGURE 2.
Dissection of Age2 functional domains.
(A) Alignment highlighting conserved KKSILSLY sequence. GAP, GAP domain; CB, Clathrin Binding. (B) Left: Fluorescence microscopy of WT Age2-Neon-3xFLAG and Age2 (KKSILSLY mutant)-Neon-3xFLAG. Maximum projections. Right: Quantification of the number of puncta in a single focal plane per cell. Error bars represent standard deviation for n > 22 cells quantified. (C) Diagram depicting Age2 truncations. GAP, GAP domain; CB, Clathrin Binding. (D) Left: Fluorescence microscopy of Age2-Neon-3xFLAG truncations. Maximum projections. Right: Quantification of the number of puncta in a single focal plane per cell. Error bars represent standard deviation for n > 22 cells quantified. (E) Complementation assay with Age2-Neon-3xFLAG mutants and truncations. Scale bars represent 2 μm. n.s., not significant; *, P ≤ 0.05, **, P ≤ 0.01, ***, P < 0.001; ****, P < 0.0001.

