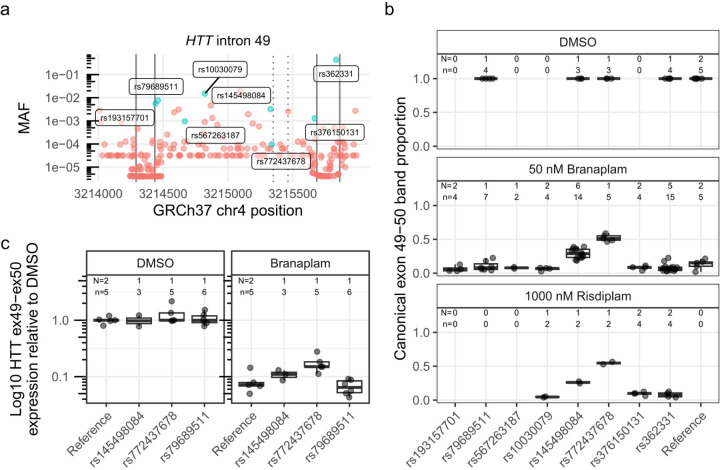
Figure 2.
Two single nucleotide variants affected HTT splice modulation. (a) Minor allele frequency (MAF) of variants spanning HTT exon 49–50 (exons marked with solid vertical lines), with variants represented in the cell lines tested labeled and highlighted in blue. The dotted vertical lines indicate the pseudoexon splice sites (ss). (b) The proportion of canonical HTT exon 49–50 product across tested cells lines, grouped by heterozygous presence of variant. Since the production of the pseudoexon requires drug treatment, only a subset of the cell lines were treated with DMSO control. (c) Absolute quantification by ddPCR across exon 49–50 junction for a subset of the cell lines on a log10 axis. N = Number of cell clones, n = cultures analyzed

