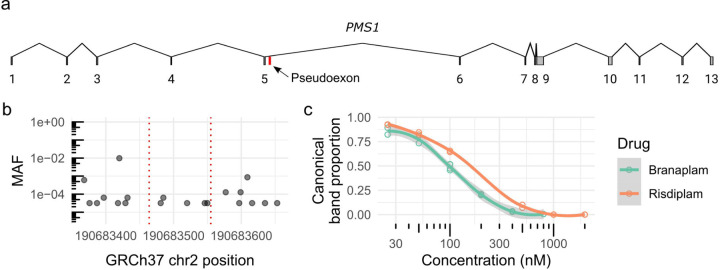
Figure 6.
HD modifier PMS1 contains a drug-inducible pseudoexon. (a) Schematic diagram of the PMS1 transcript (NM_000534) highlighting the pseudoexon location in red. (b) Minor allele frequency (MAF) of variants 50 bp surrounding the pseudoexon location (red dotted lines). (c) Dose response of PMS1 exon 5–6 after branaplam (teal) or risdiplam (red) treatment with each empty dot representing a biological replicate and the line showing the local polynomial regression.

