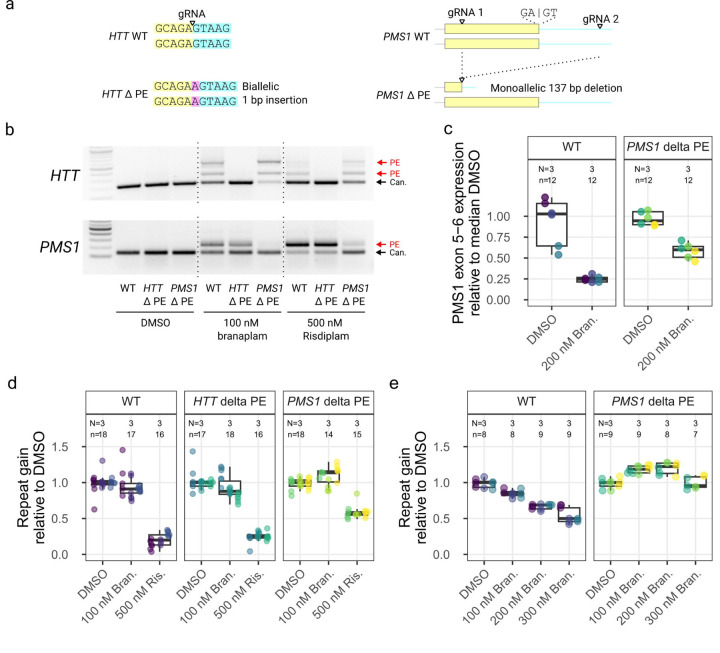
Figure 7.
PMS1 pseudoexon inclusion explained the effect on repeat expansion with branaplam, but only partially with risdiplam. (a) Schematic diagrams showing the CRISPR-Cas9 targeting approach for the disruption of pseudoexon (PE) sequences in HTT (left) and PMS1 (right). Yellow indicates pseudoexon sequence upstream of the 5’ splice site targeted by the drug, blue representing the downstream intronic sequence, with the inserted sequence highlighted in purple. (b) PCR analysis over the HTT (top) and PMS1 (bottom) pseudoexon splice junctions with branaplam or risdiplam treatment for the control and pseudoexon edited cell lines. (c) Accurate quantification of PMS1 canonical isoform by ddPCR for the control and PMS1 pseudoexon edited cell lines. The dot color represents a unique cell line. (d, e) The average repeat gain per week after branaplam or risdiplam treatment for the different edited cell lines (dot color), normalized on the average repeat gain in the DMSO for each genotype.

