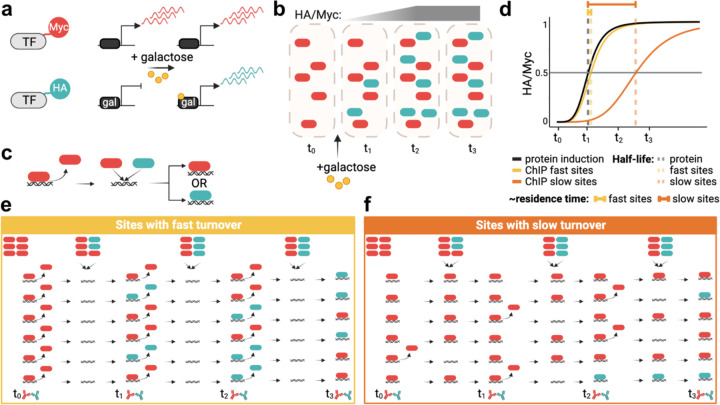
Fig. 1. Competition ChIP overview.
(a) A Myc-tagged isoform of a TF is expressed constitutively using the endogenous promoter, while an HA-isoform is expressed under control of a galactose-inducible promoter. (b) Illustration showing protein induction upon adding galactose. The HA/Myc ratio increases over time until it reaches saturation. (c) Once a given TF unbinds DNA, the two isoforms compete for binding to the available site. (d) Simplified illustration of residence time estimation based on the lag of the normalized HA/Myc ChIP signal ratio relative to the competitor protein induction curve, as further illustrated in (e) for sites with fast turnover and (f) for sites with slow turnover. In (e,f) the icons in the top row indicate relative levels of constitutive (red) and competitor (green) isoforms.

