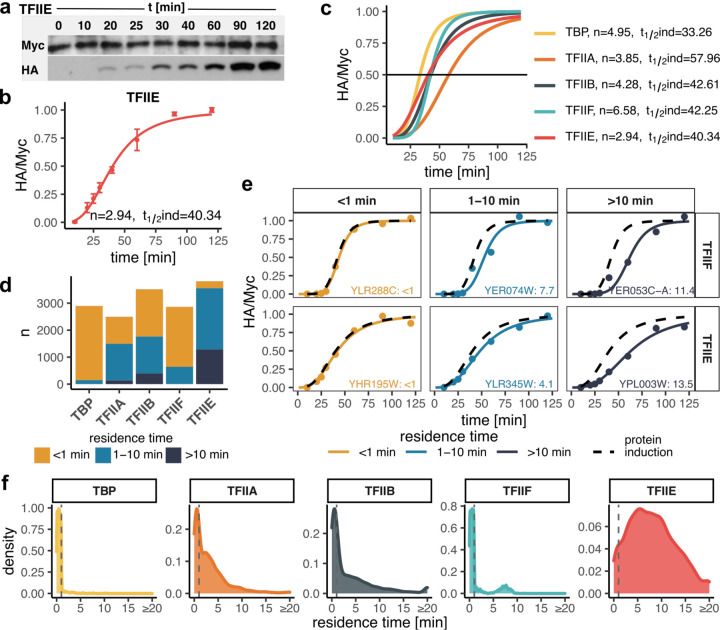
Fig. 2. GTF residence times.
(a) TFIIE Western blots showing the isoform levels of the TFIIE subunit over the indicated time course. Galactose was added at t = 0 min. (b) Quantified Western blots from (a). Shown are normalized HA/Myc ratios with error bars representing standard deviation (n = 3). The induction curve was fitted with a Hill coefficient (n) and induction half-time (t1/2ind) as indicated. (c) Induction curves as in (b) for all targeted TFs with fit parameters indicated on the right. (d) Bar plot showing the number of sites (y-axis) categorized based on estimated residence time for each TF (x-axis). (e) Examples of sites with fast (<1 min), moderate (1–10 min) and slow (>10 min) turnover for TFIIF and TFIIE. Black dashed curves represent protein induction curves from (c), in color are shown the normalized HA/Myc ChIP signals (mapped reads) along with the fitted model. Gene target names along with the estimated residence times are included. (f) Distribution of estimated residence times for all GTFs. Values for reliably fast sites (<1 min) were randomly generated for plotting purposes and are separated by dashed lines.

